

August 2026: Tri-Cities Real Estate Market Stats | Port Moody, Coquitlam, Port Coquitlam, Anmore & Belcarra

The August 2026 Real Estate Market Stats, provided by the Real Estate Board of Greater Vancouver (Greater Vancouver REALTORS®), have been released for Port Moody, Coquitlam, Port Coquitlam, Anmore and Belcarra. Please see below for a summary of the August 2026 Real Estate Stats.
Source: (Greater Vancouver REALTORS®) - a research tool provided by the Real Estate Board of Greater Vancouver.
Port Moody Real Estate Market Stats For August 2026
(including Anmore & Belcarra)
PORT MOODY:
The Port Moody market stats include the neighbourhoods of Anmore, Barber Street, Belcarra, College Park, Glenayre, Heritage Mountain, Heritage Woods, Ioco, Mountain Meadows, North Shore Port Moody and Port Moody Centre.
Port Moody Detached Properties:
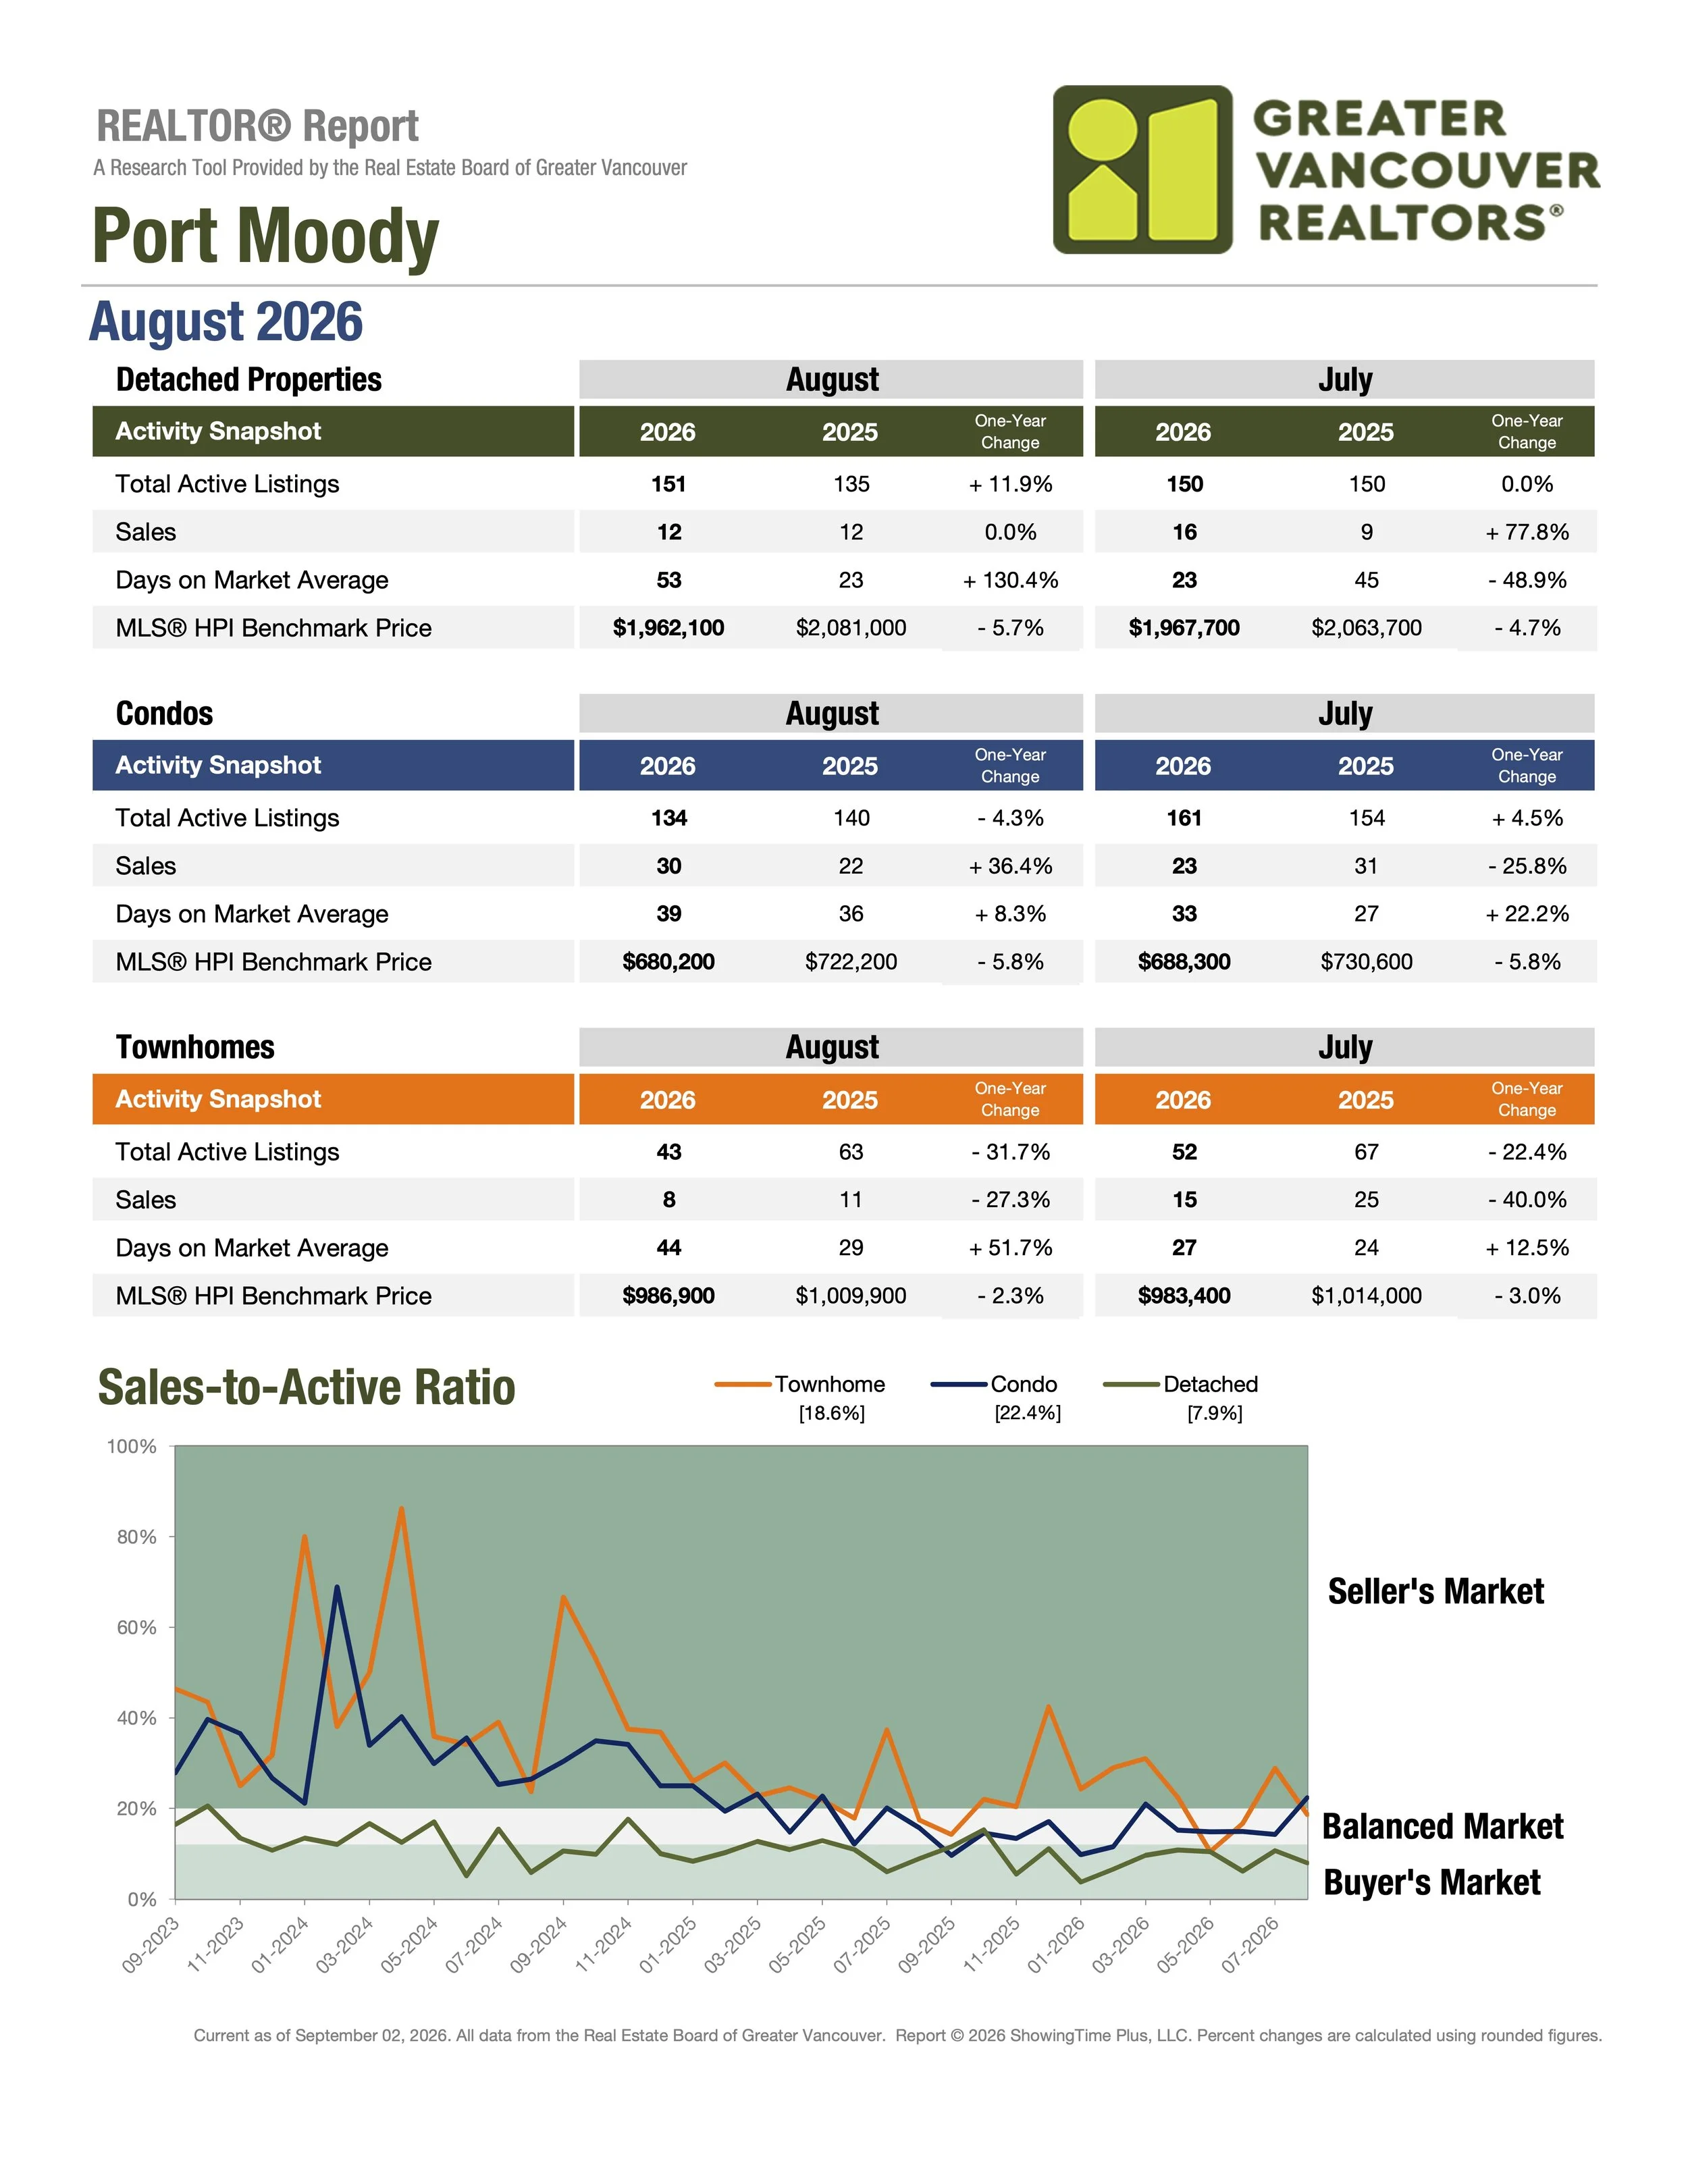
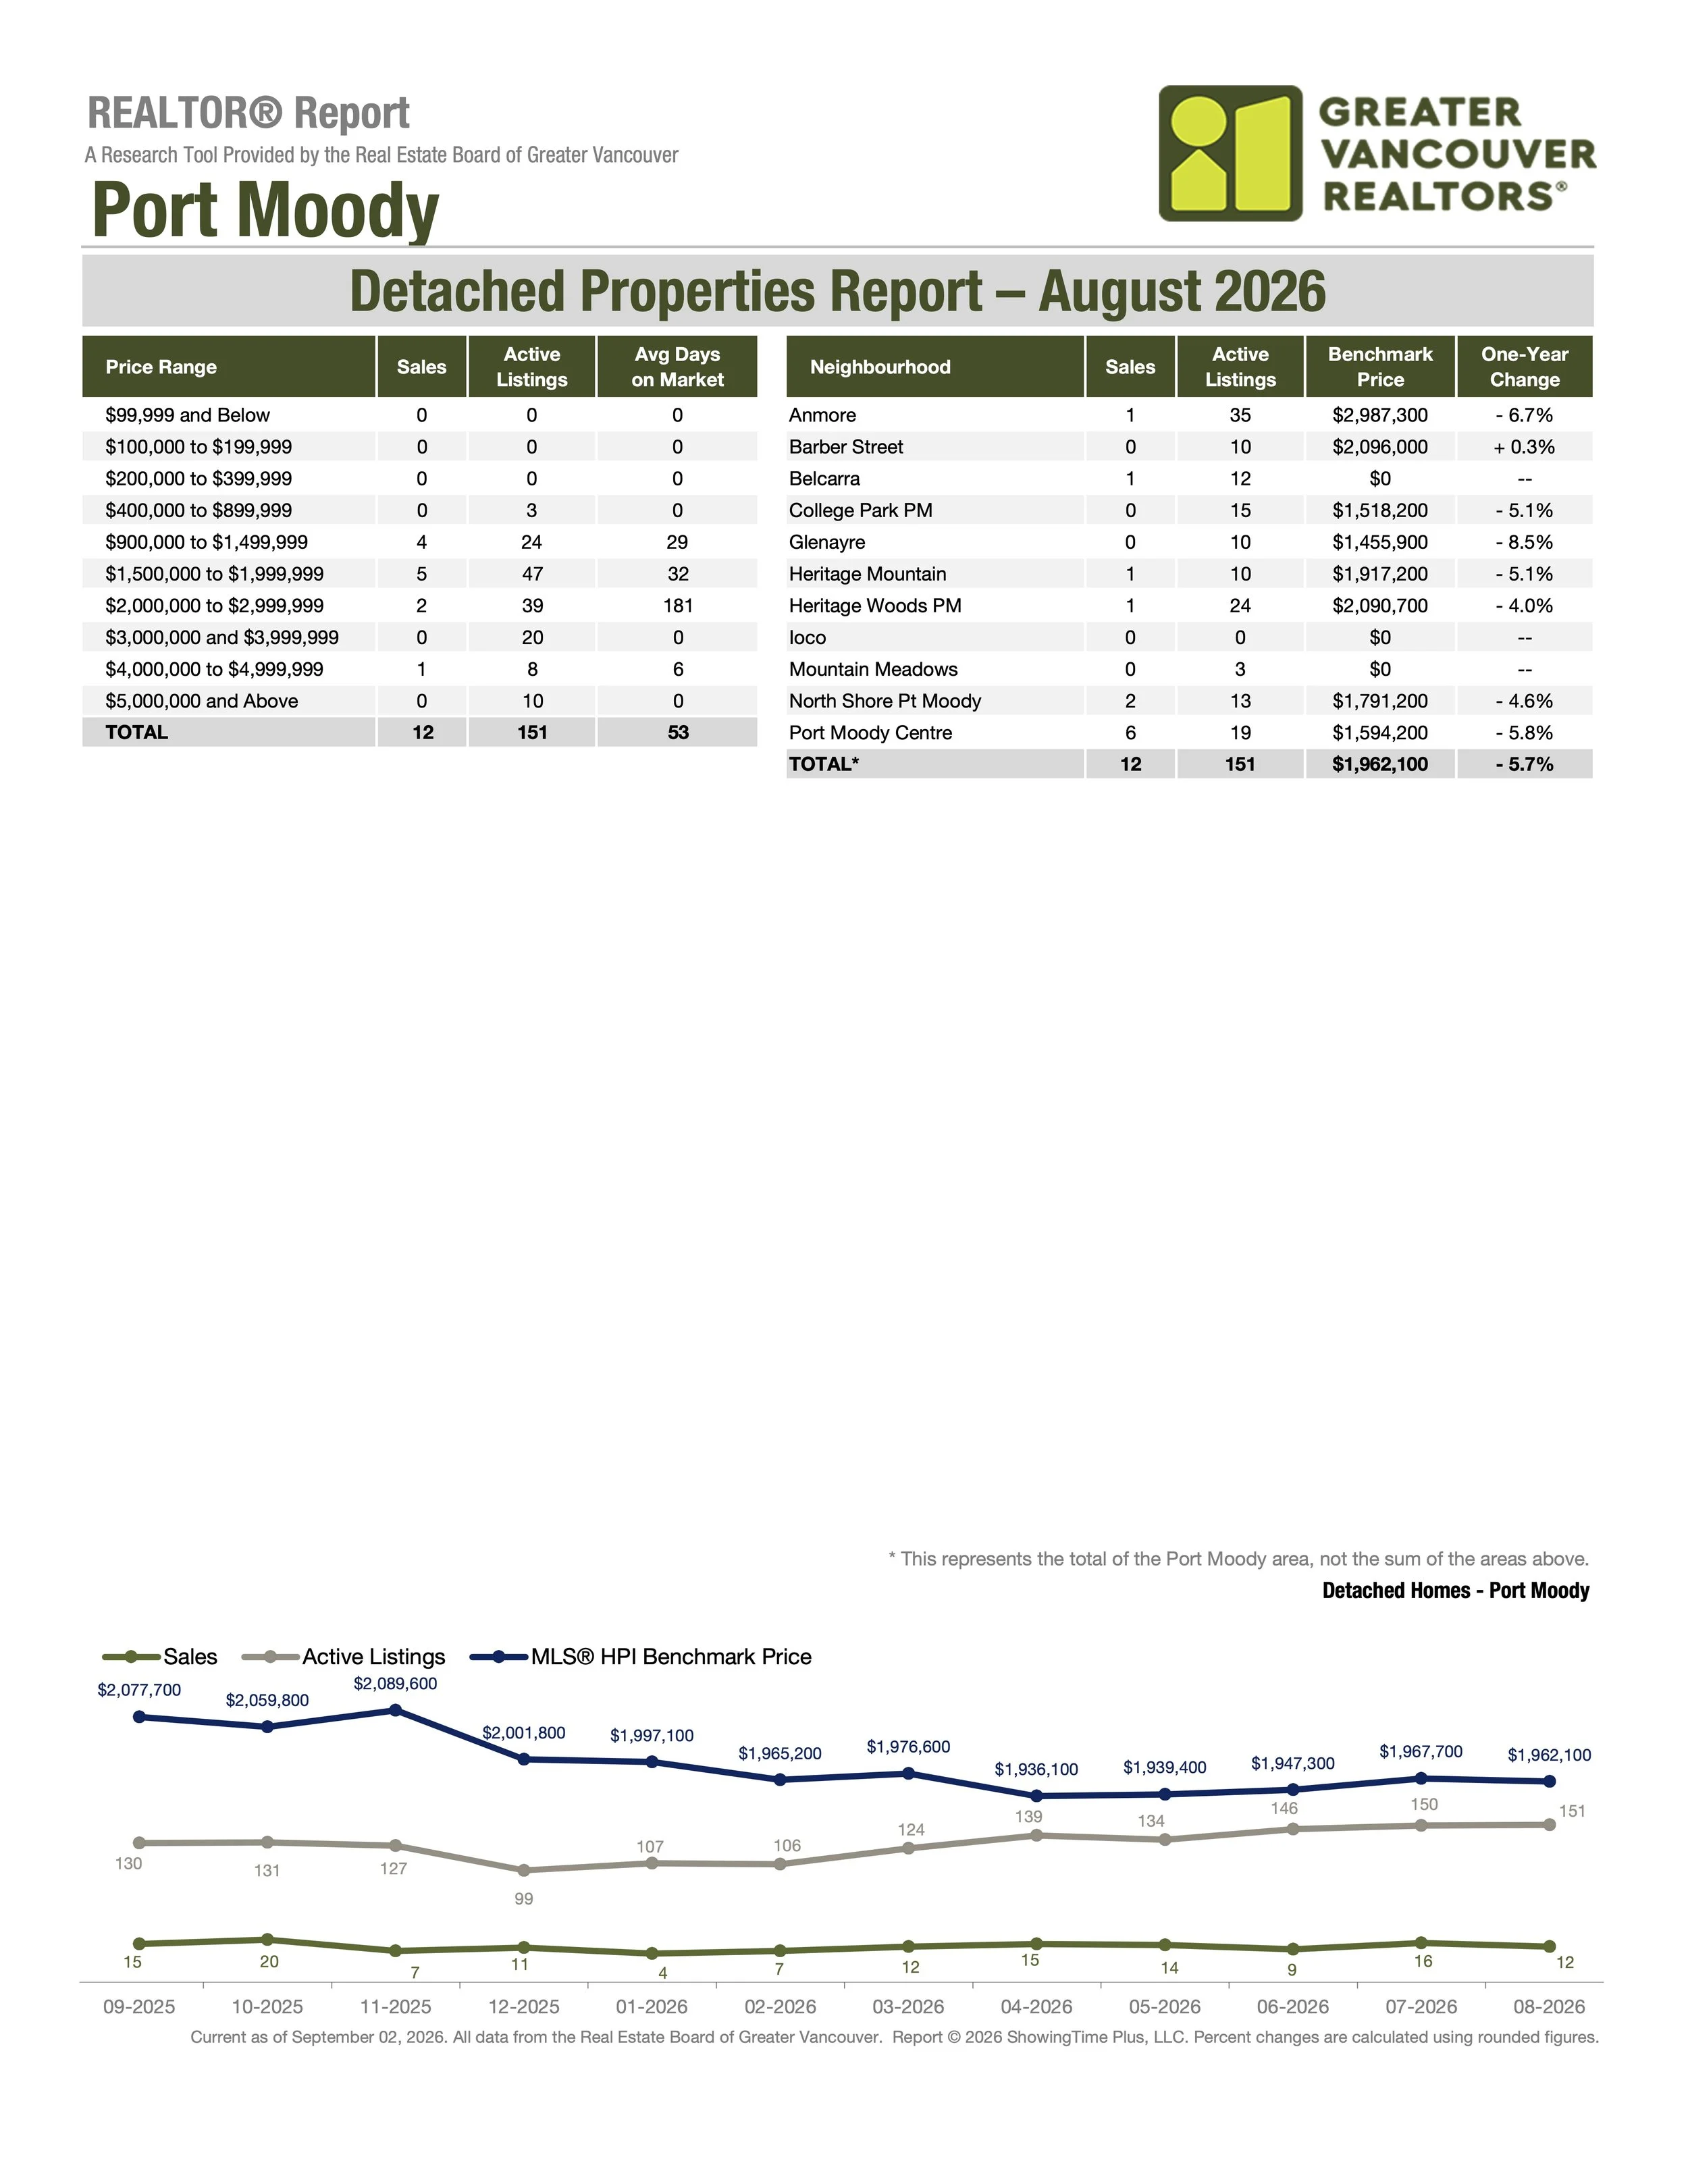
The total number of active listings on MLS® for Port Moody detached properties in August 2026 was 151 vs 135 in August 2025, an increase of 11.9%. The total number of sales on MLS® for Port Moody detached properties in August 2026 was 12 vs 12 in August 2025, a change of 0.0%. The average days on market on MLS® for Port Moody detached properties in August 2026 was 53 vs 23 in August 2025, an increase of 130.4%. The MLS® HPI Benchmark Price for Port Moody detached properties in August 2026 was $1,962,100 vs $2,081,000 in August 2025, a decrease of 5.7% or $118,900.
Port Moody Condos:
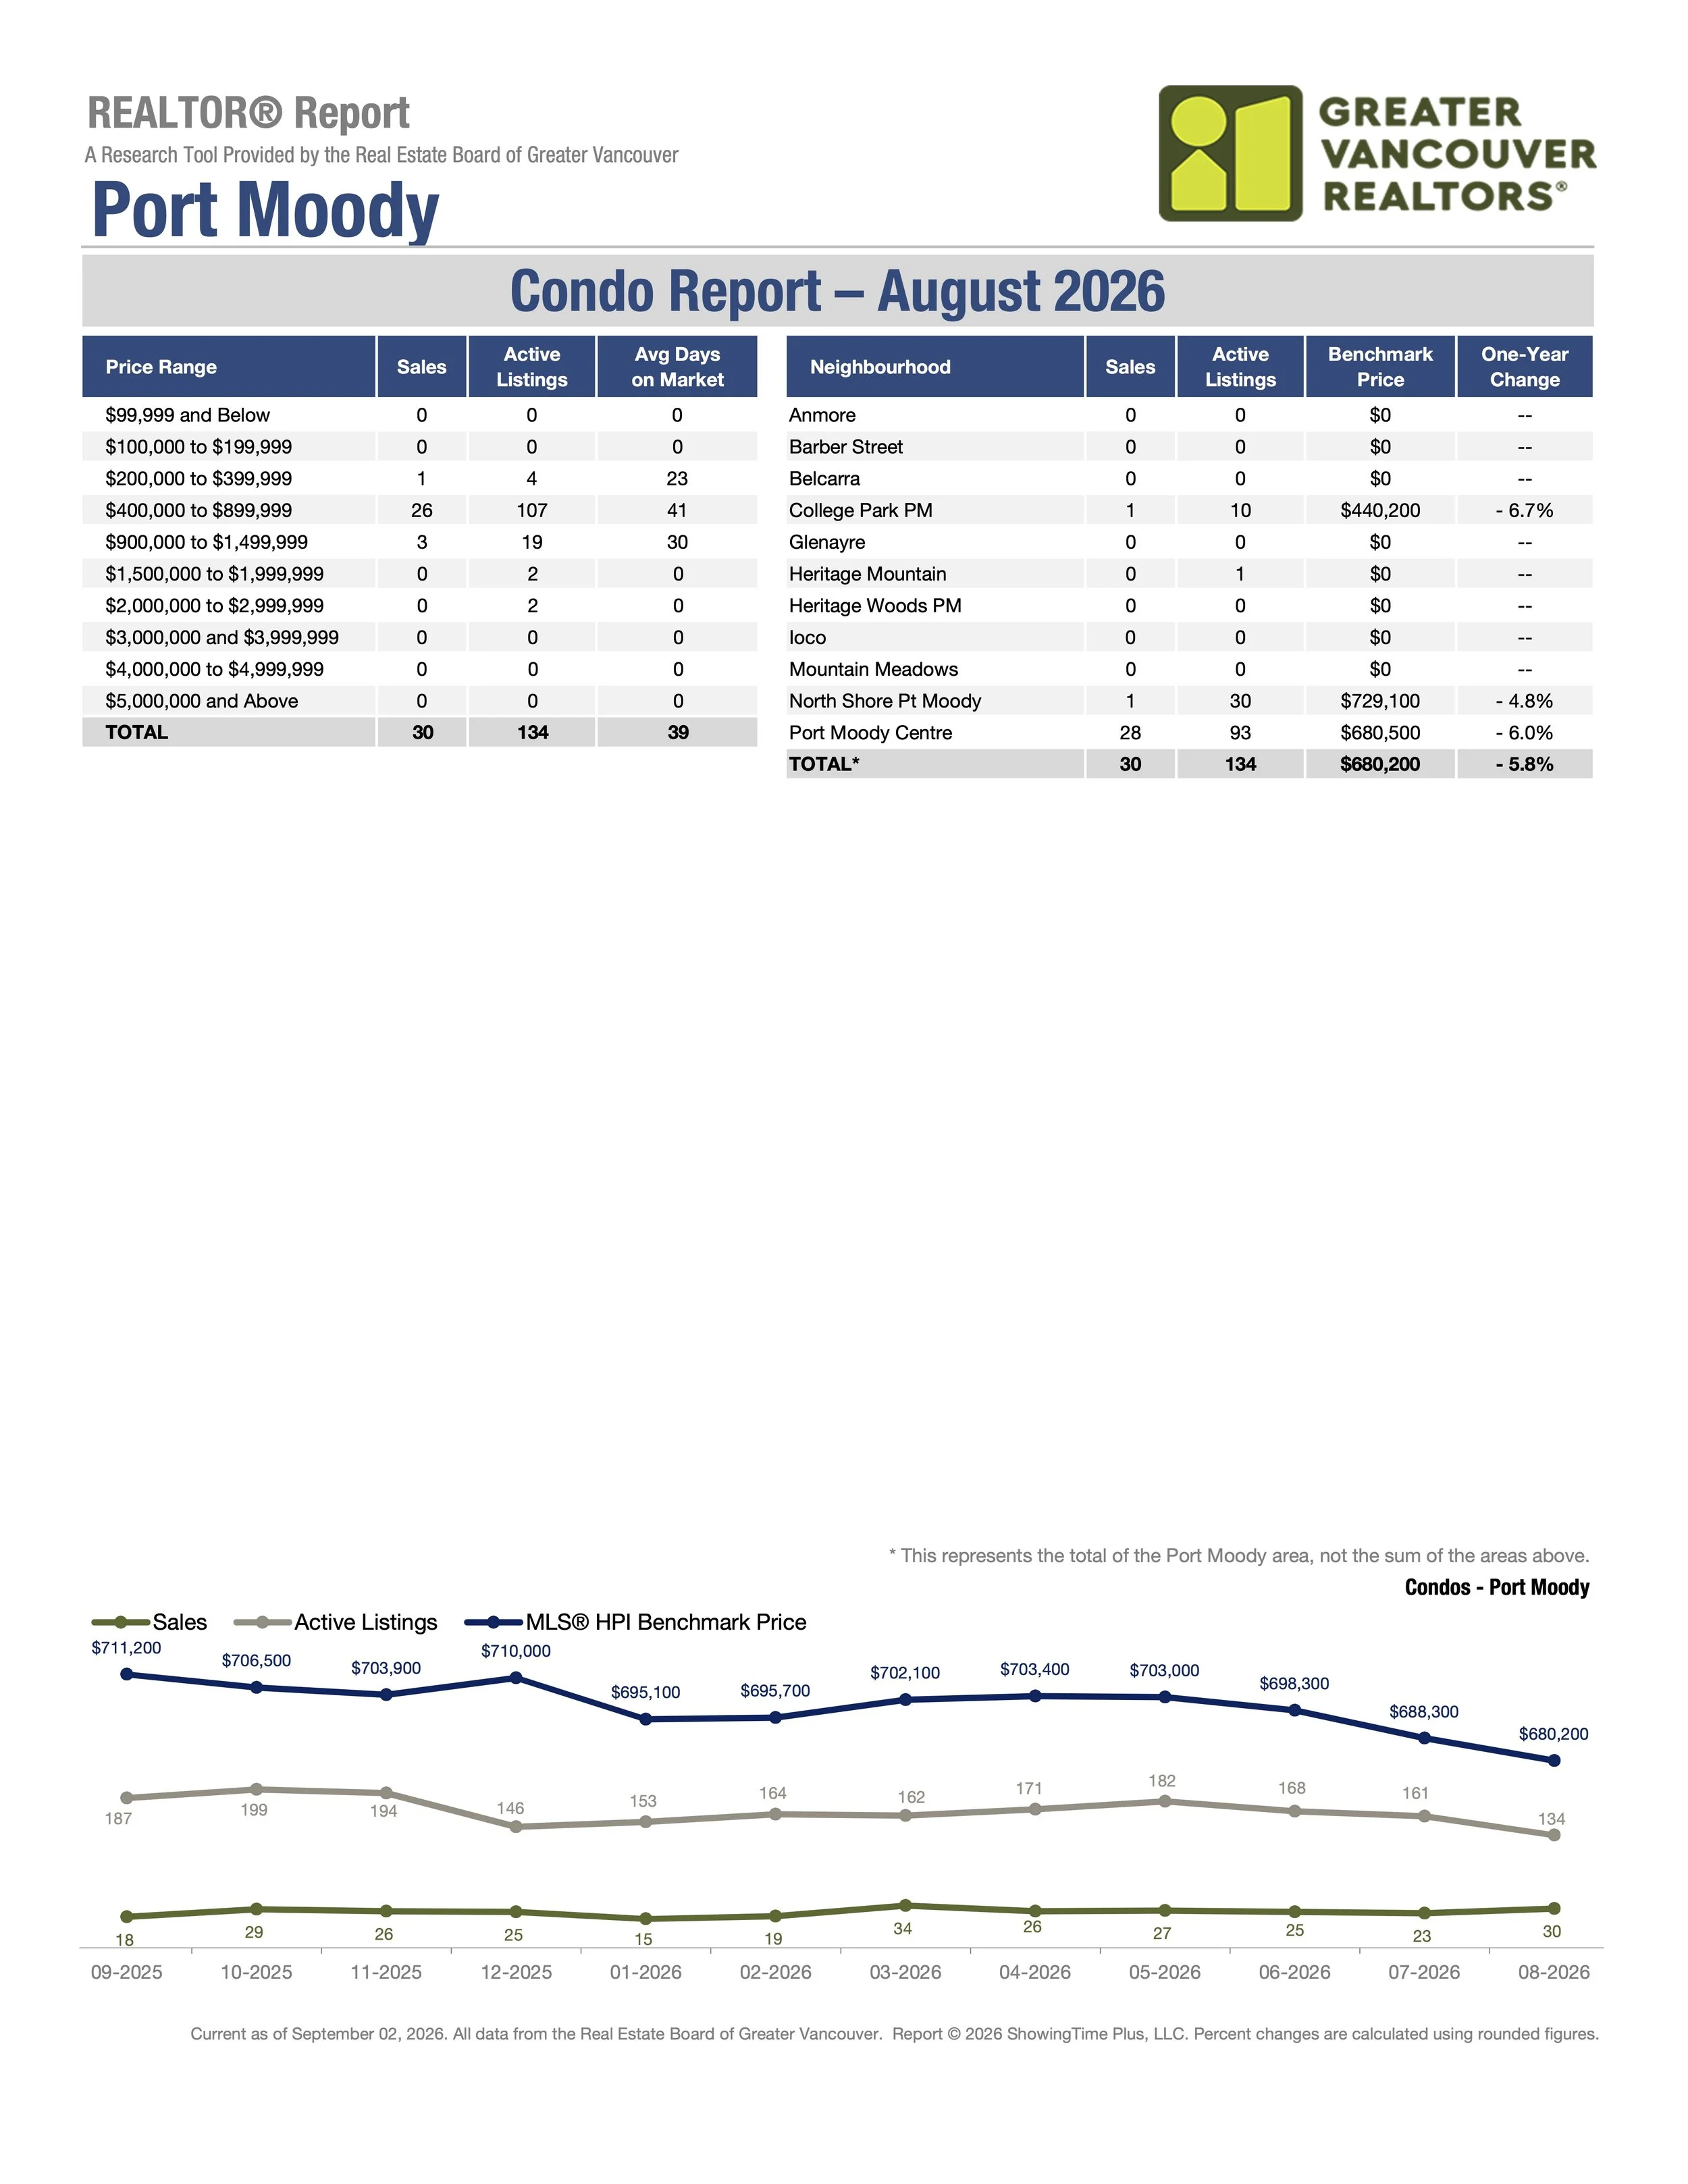
The total number of active listings on MLS® for Port Moody condos in August 2026 was 134 vs 140 in August 2025, a decrease of 4.3%. The total number of sales on MLS® for Port Moody condos in August 2026 was 30 vs 22 in August 2025, an increase of 36.4%. The average days on market on MLS® for Port Moody condos in August 2026 was 39 vs 36 in August 2025, an increase of 8.3%. The MLS® HPI Benchmark Price for Port Moody condos in August 2026 was $680,200 vs $722,200 in August 2025, a decrease of 5.8% or $42,000.
Port Moody Townhomes:
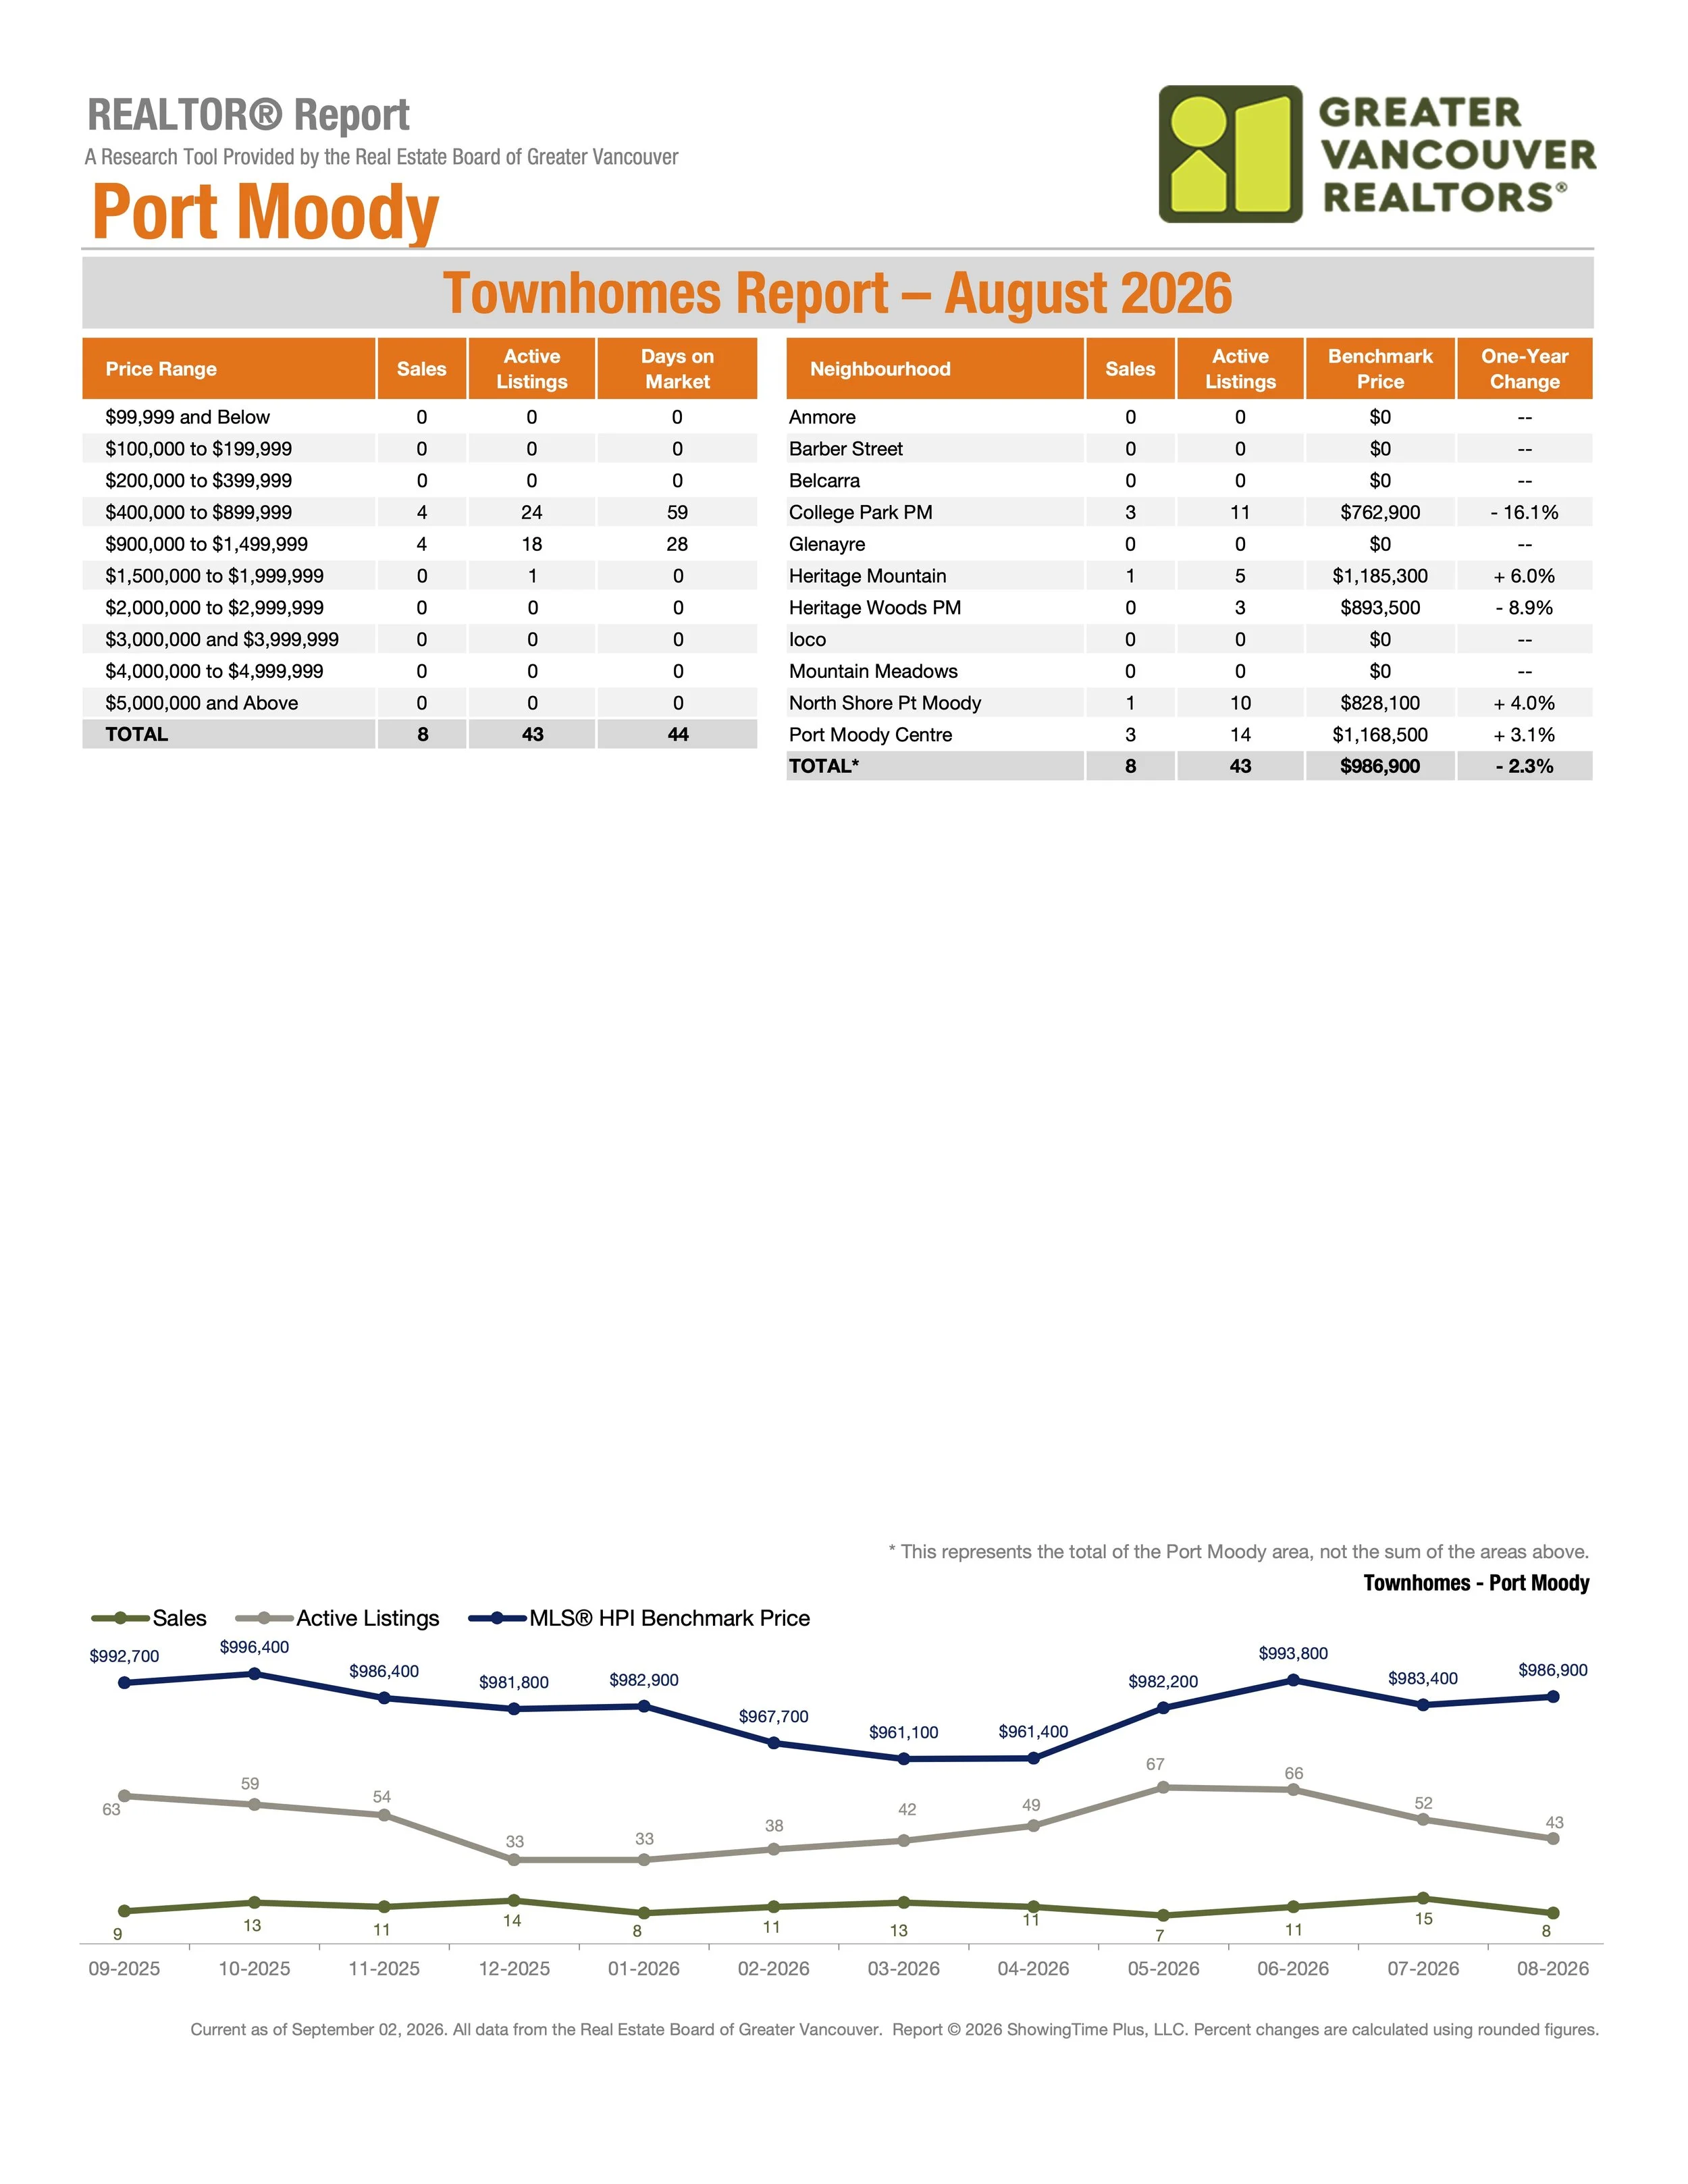
The total number of active listings on MLS® for Port Moody townhomes in August 2026 was 43 vs 63 in August 2025, a decrease of 31.7%. The total number of sales on MLS® for Port Moody townhomes in August 2026 was 8 vs 11 in August 2025, a decrease of 27.3%. The average days on market on MLS® for Port Moody townhomes in August 2026 was 44 vs 29 in August 2025, an increase of 51.7%. The MLS® HPI Benchmark Price for Port Moody townhomes in August 2026 was $986,900 vs $1,009,900 in August 2025, a decrease of 2.3% or $23,000.
Anmore Detached Properties:
The total number of active listings on MLS® for Anmore detached properties in August 2026 was 35. The total number of sales on MLS® for Anmore detached properties in August 2026 was 1. The MLS® HPI Benchmark Price for Anmore detached properties in August 2026 was $2,987,300, a decrease of 6.7% from August 2025.
Belcarra Detached Properties:
The total number of active listings on MLS® for Belcarra detached properties in August 2026 was 12. The total number of sales on MLS® for Belcarra detached properties in August 2026 was 1.
Coquitlam Real Estate Market Stats For August 2026
COQUITLAM:
The Coquitlam market stats include the neighbourhoods of Burke Mountain, Canyon Springs, Cape Horn, Central Coquitlam, Chineside, Coquitlam East, Coquitlam West, Eagle Ridge, Harbour Chines, Harbour Place, Hockaday, Maillardville, Meadow Brook, New Horizons, North Coquitlam, Park Ridge Estates, Ranch Park, River Springs, Scott Creek, Summitt View, Upper Eagle Ridge, Westwood Plateau and Westwood Plateau Summit.
Coquitlam Detached Properties:
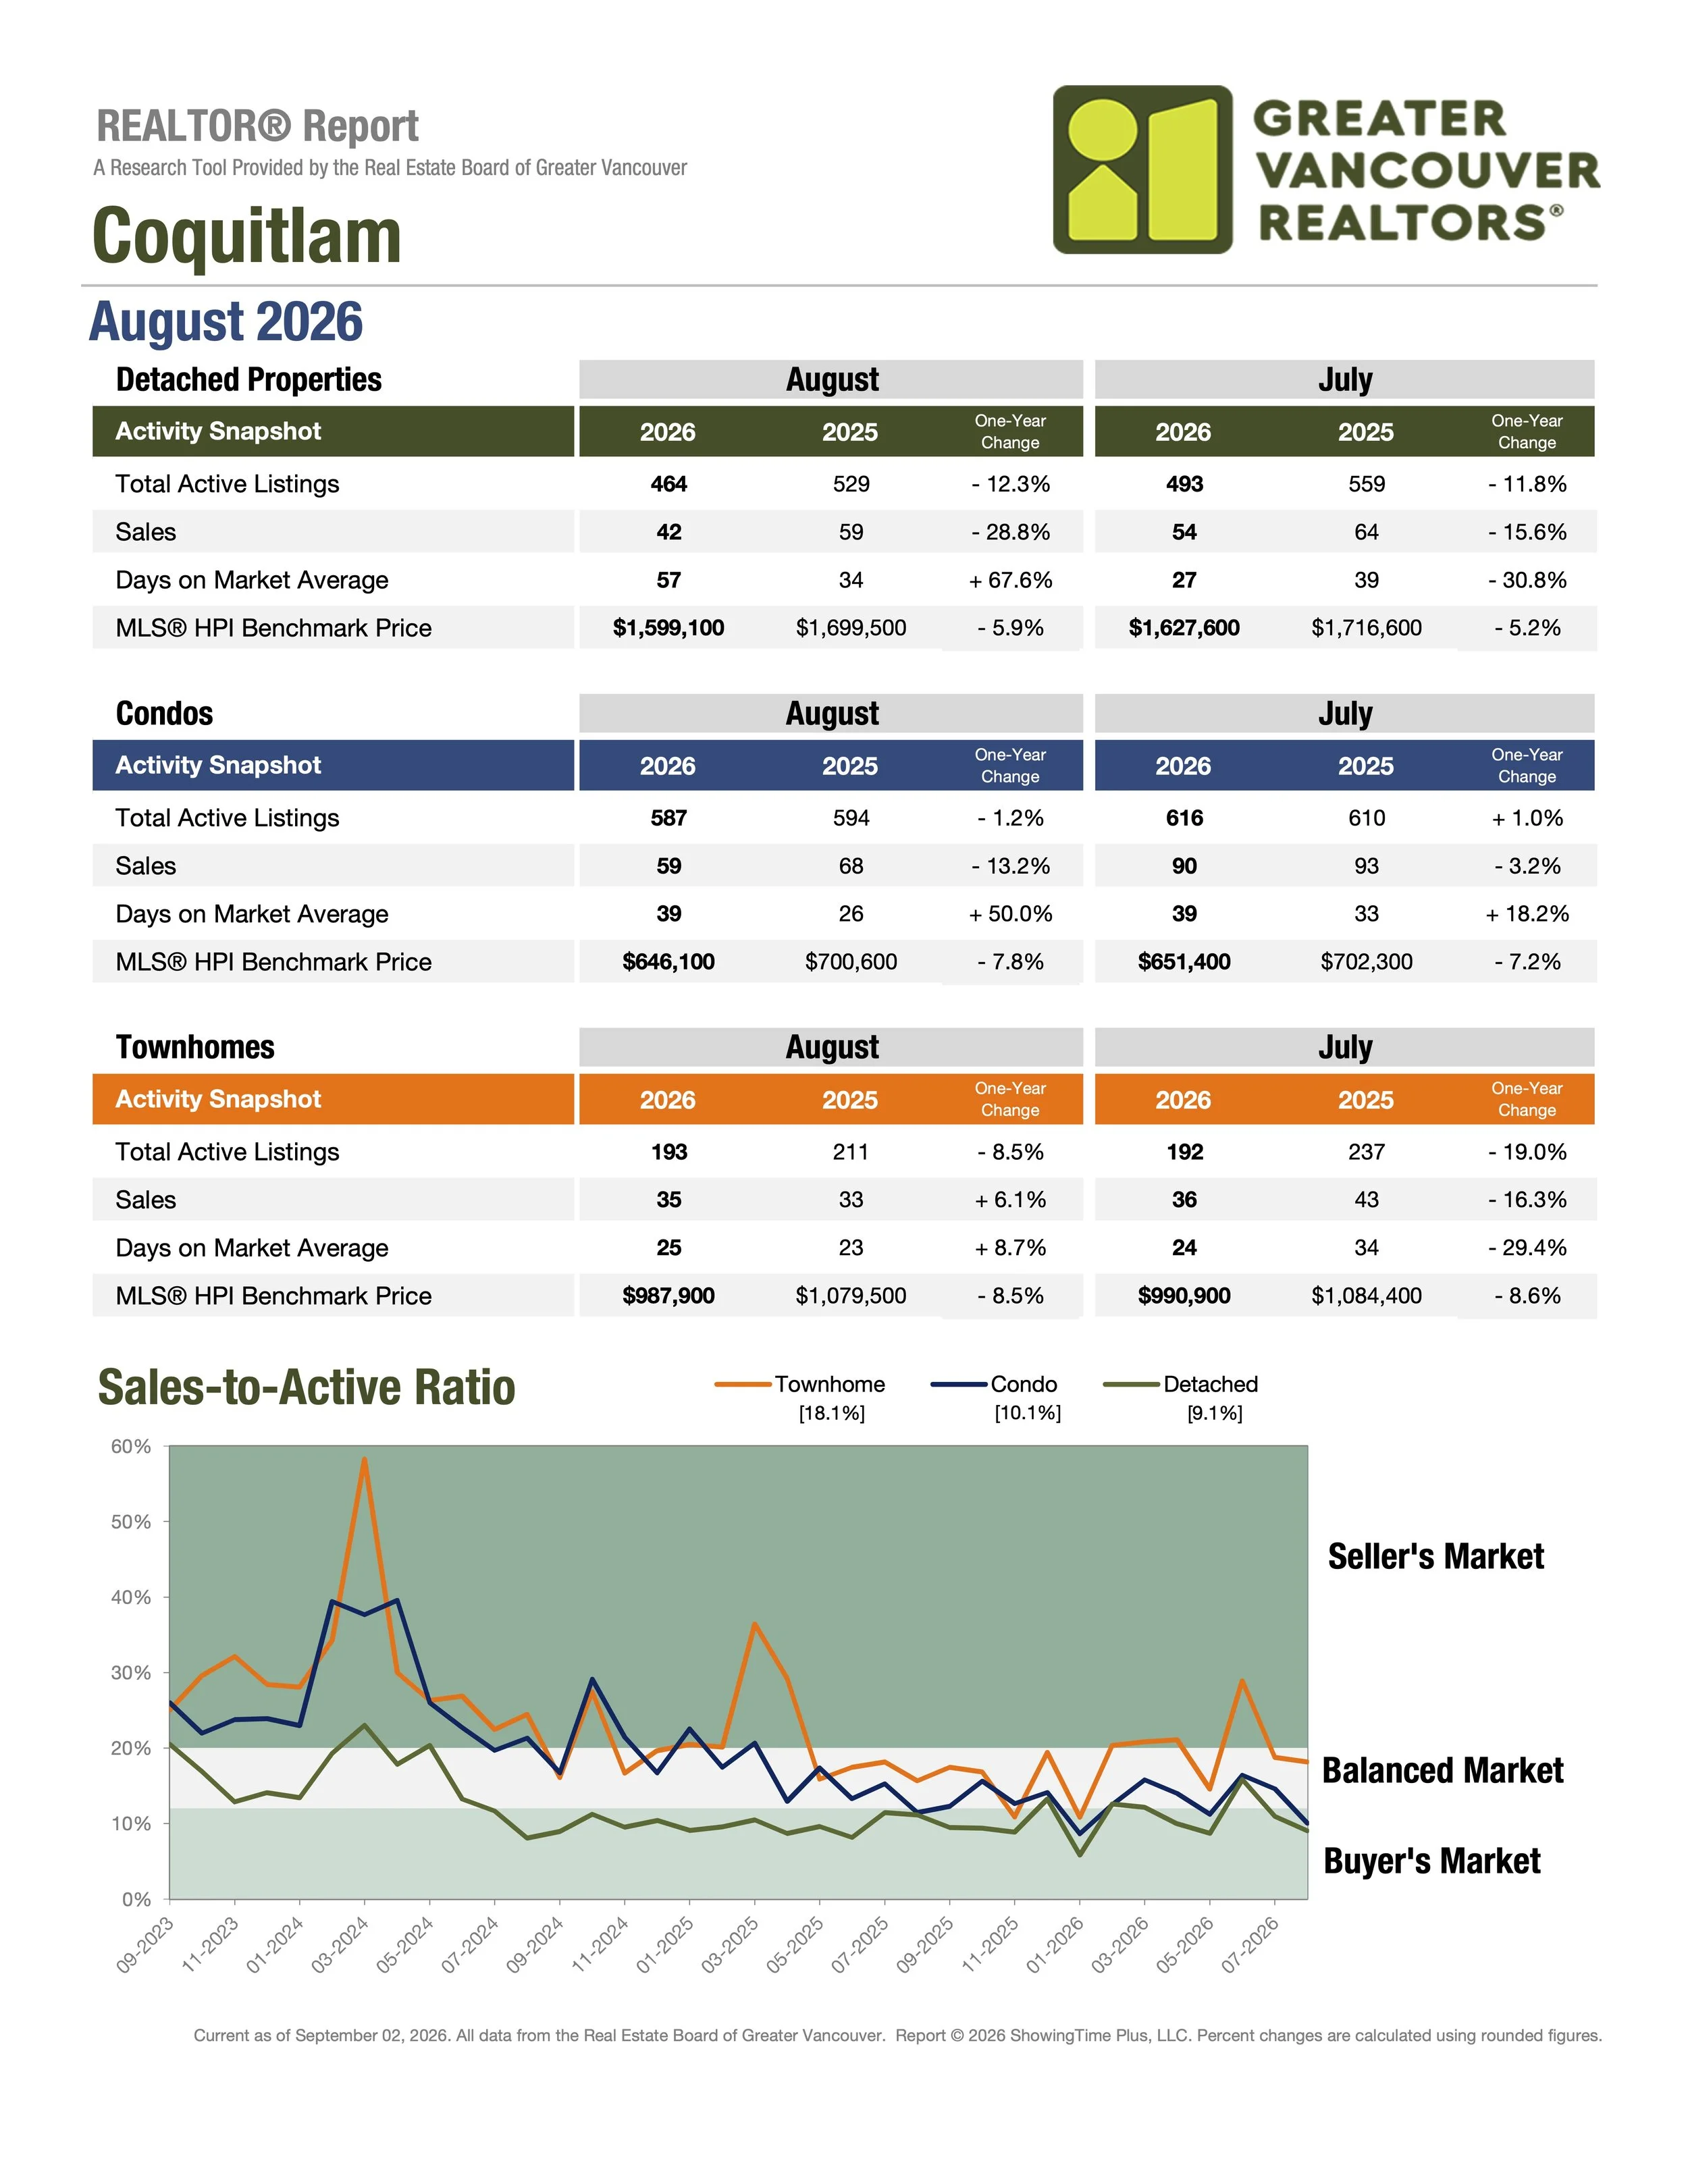
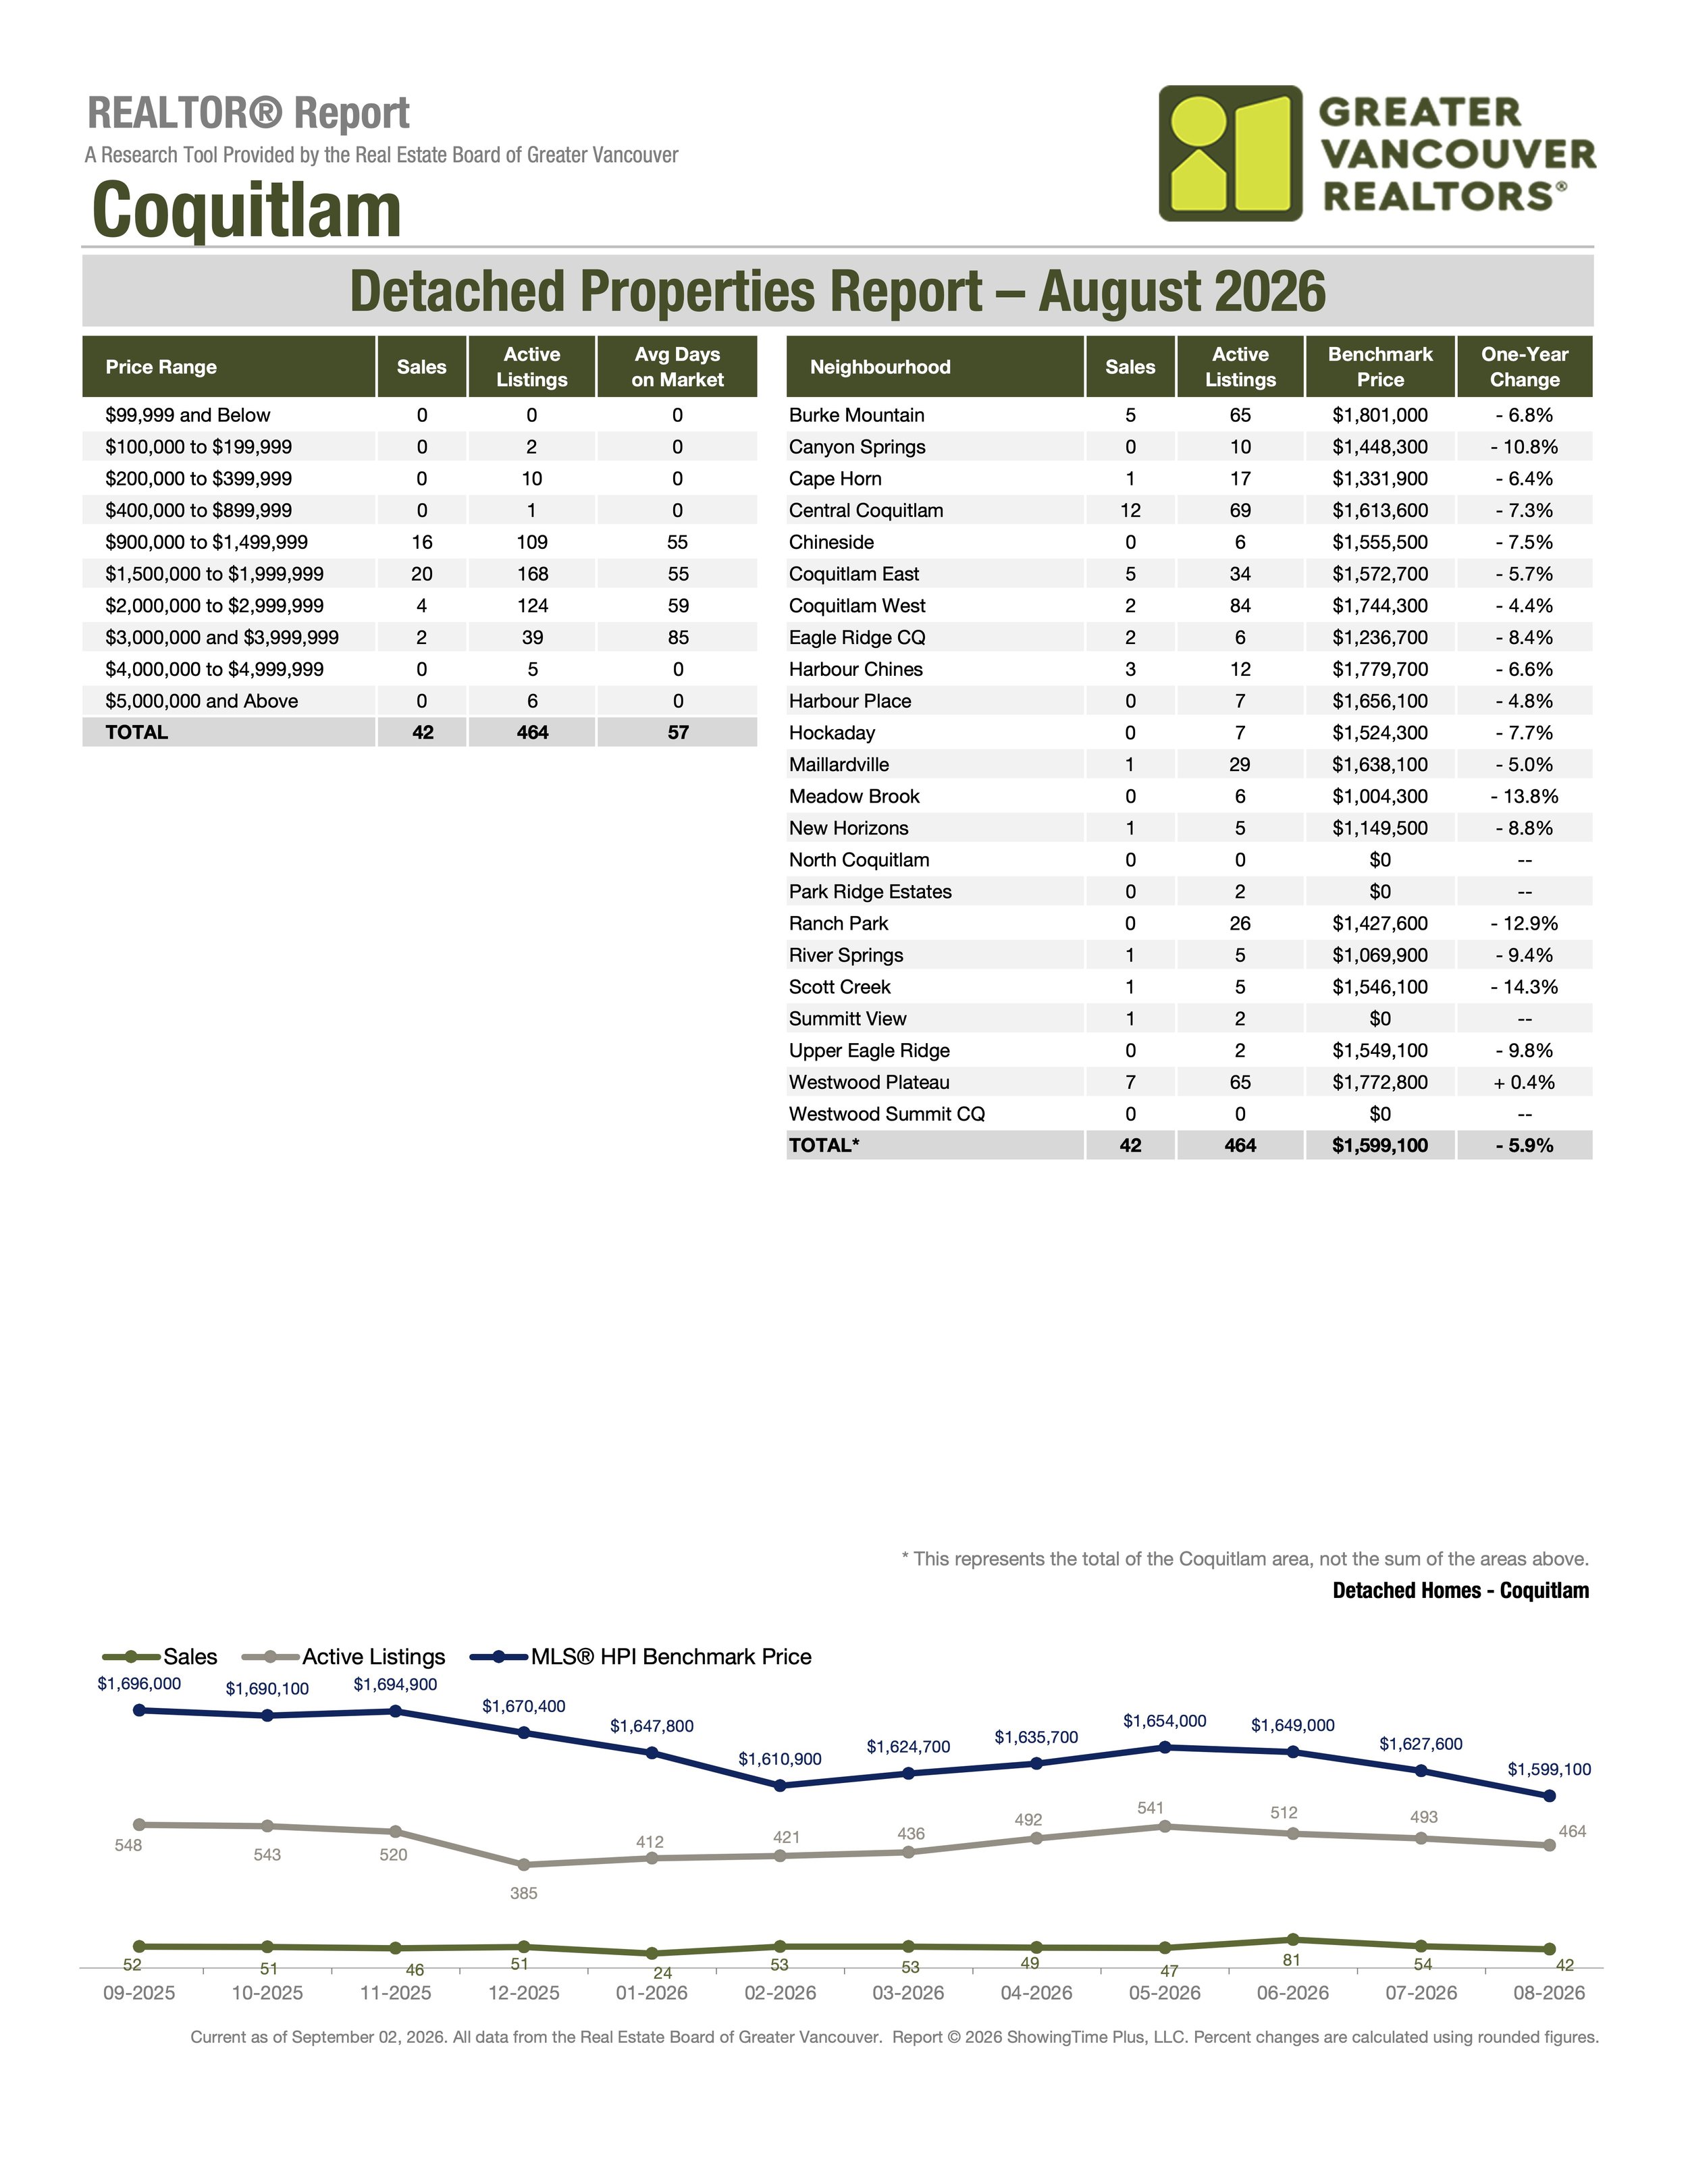
The total number of active listings on MLS® for Coquitlam detached properties in August 2026 was 464 vs 529 in August 2025, a decrease of 12.3%. The total number of sales on MLS® for Coquitlam detached properties in August 2026 was 42 vs 59 in August 2025, a decrease of 28.8%. The average days on market on MLS® for Coquitlam detached properties in August 2026 was 57 vs 34 in August 2025, an increase of 67.6%. The MLS® HPI Benchmark Price for Coquitlam detached properties in August 2026 was $1,599,100 vs $1,699,500 in August 2025, a decrease of 5.9% or $100,400.
Coquitlam Condos:
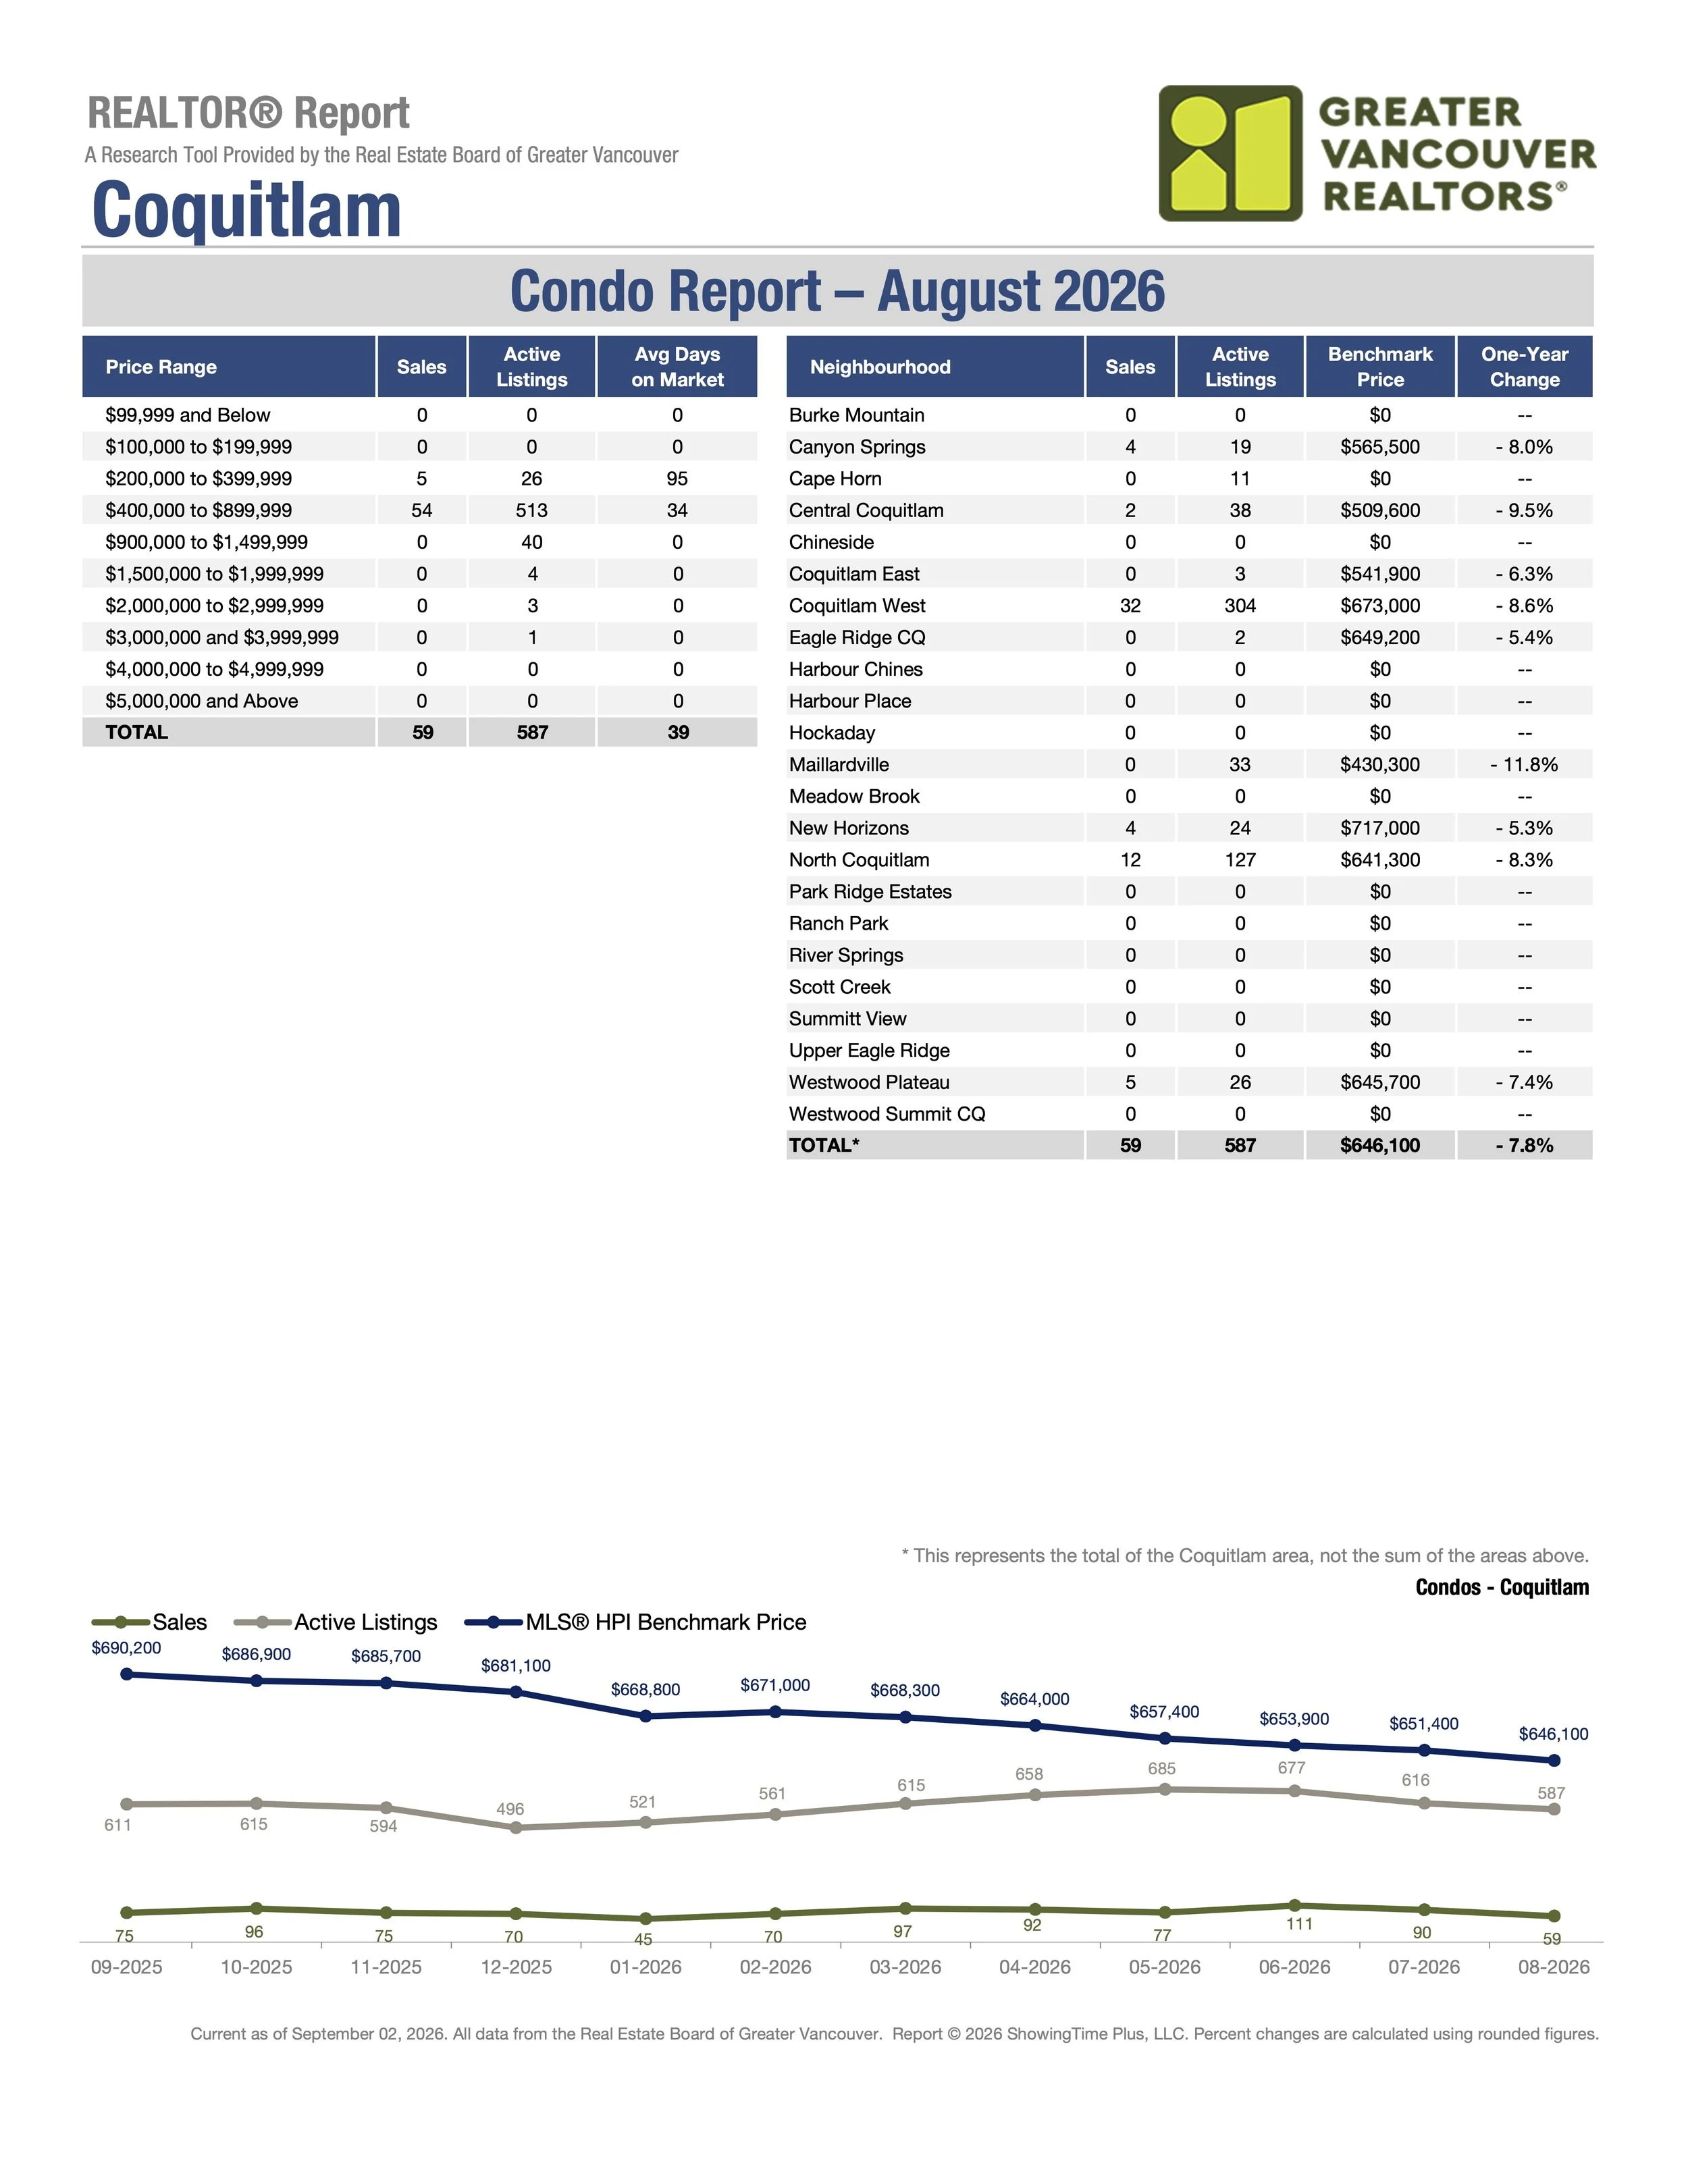
The total number of active listings on MLS® for Coquitlam condos in August 2026 was 587 vs 594 in August 2025, a decrease of 1.2%. The total number of sales on MLS® for Coquitlam condos in August 2026 was 59 vs 68 in August 2025, a decrease of 13.2%. The average days on market on MLS® for Coquitlam condos in August 2026 was 39 vs 26 in August 2025, an increase of 50.0%. The MLS® HPI Benchmark Price for Coquitlam condos in August 2026 was $646,100 vs $700,600 in August 2025, a decrease of 7.8% or $54,500.
Coquitlam Townhomes:
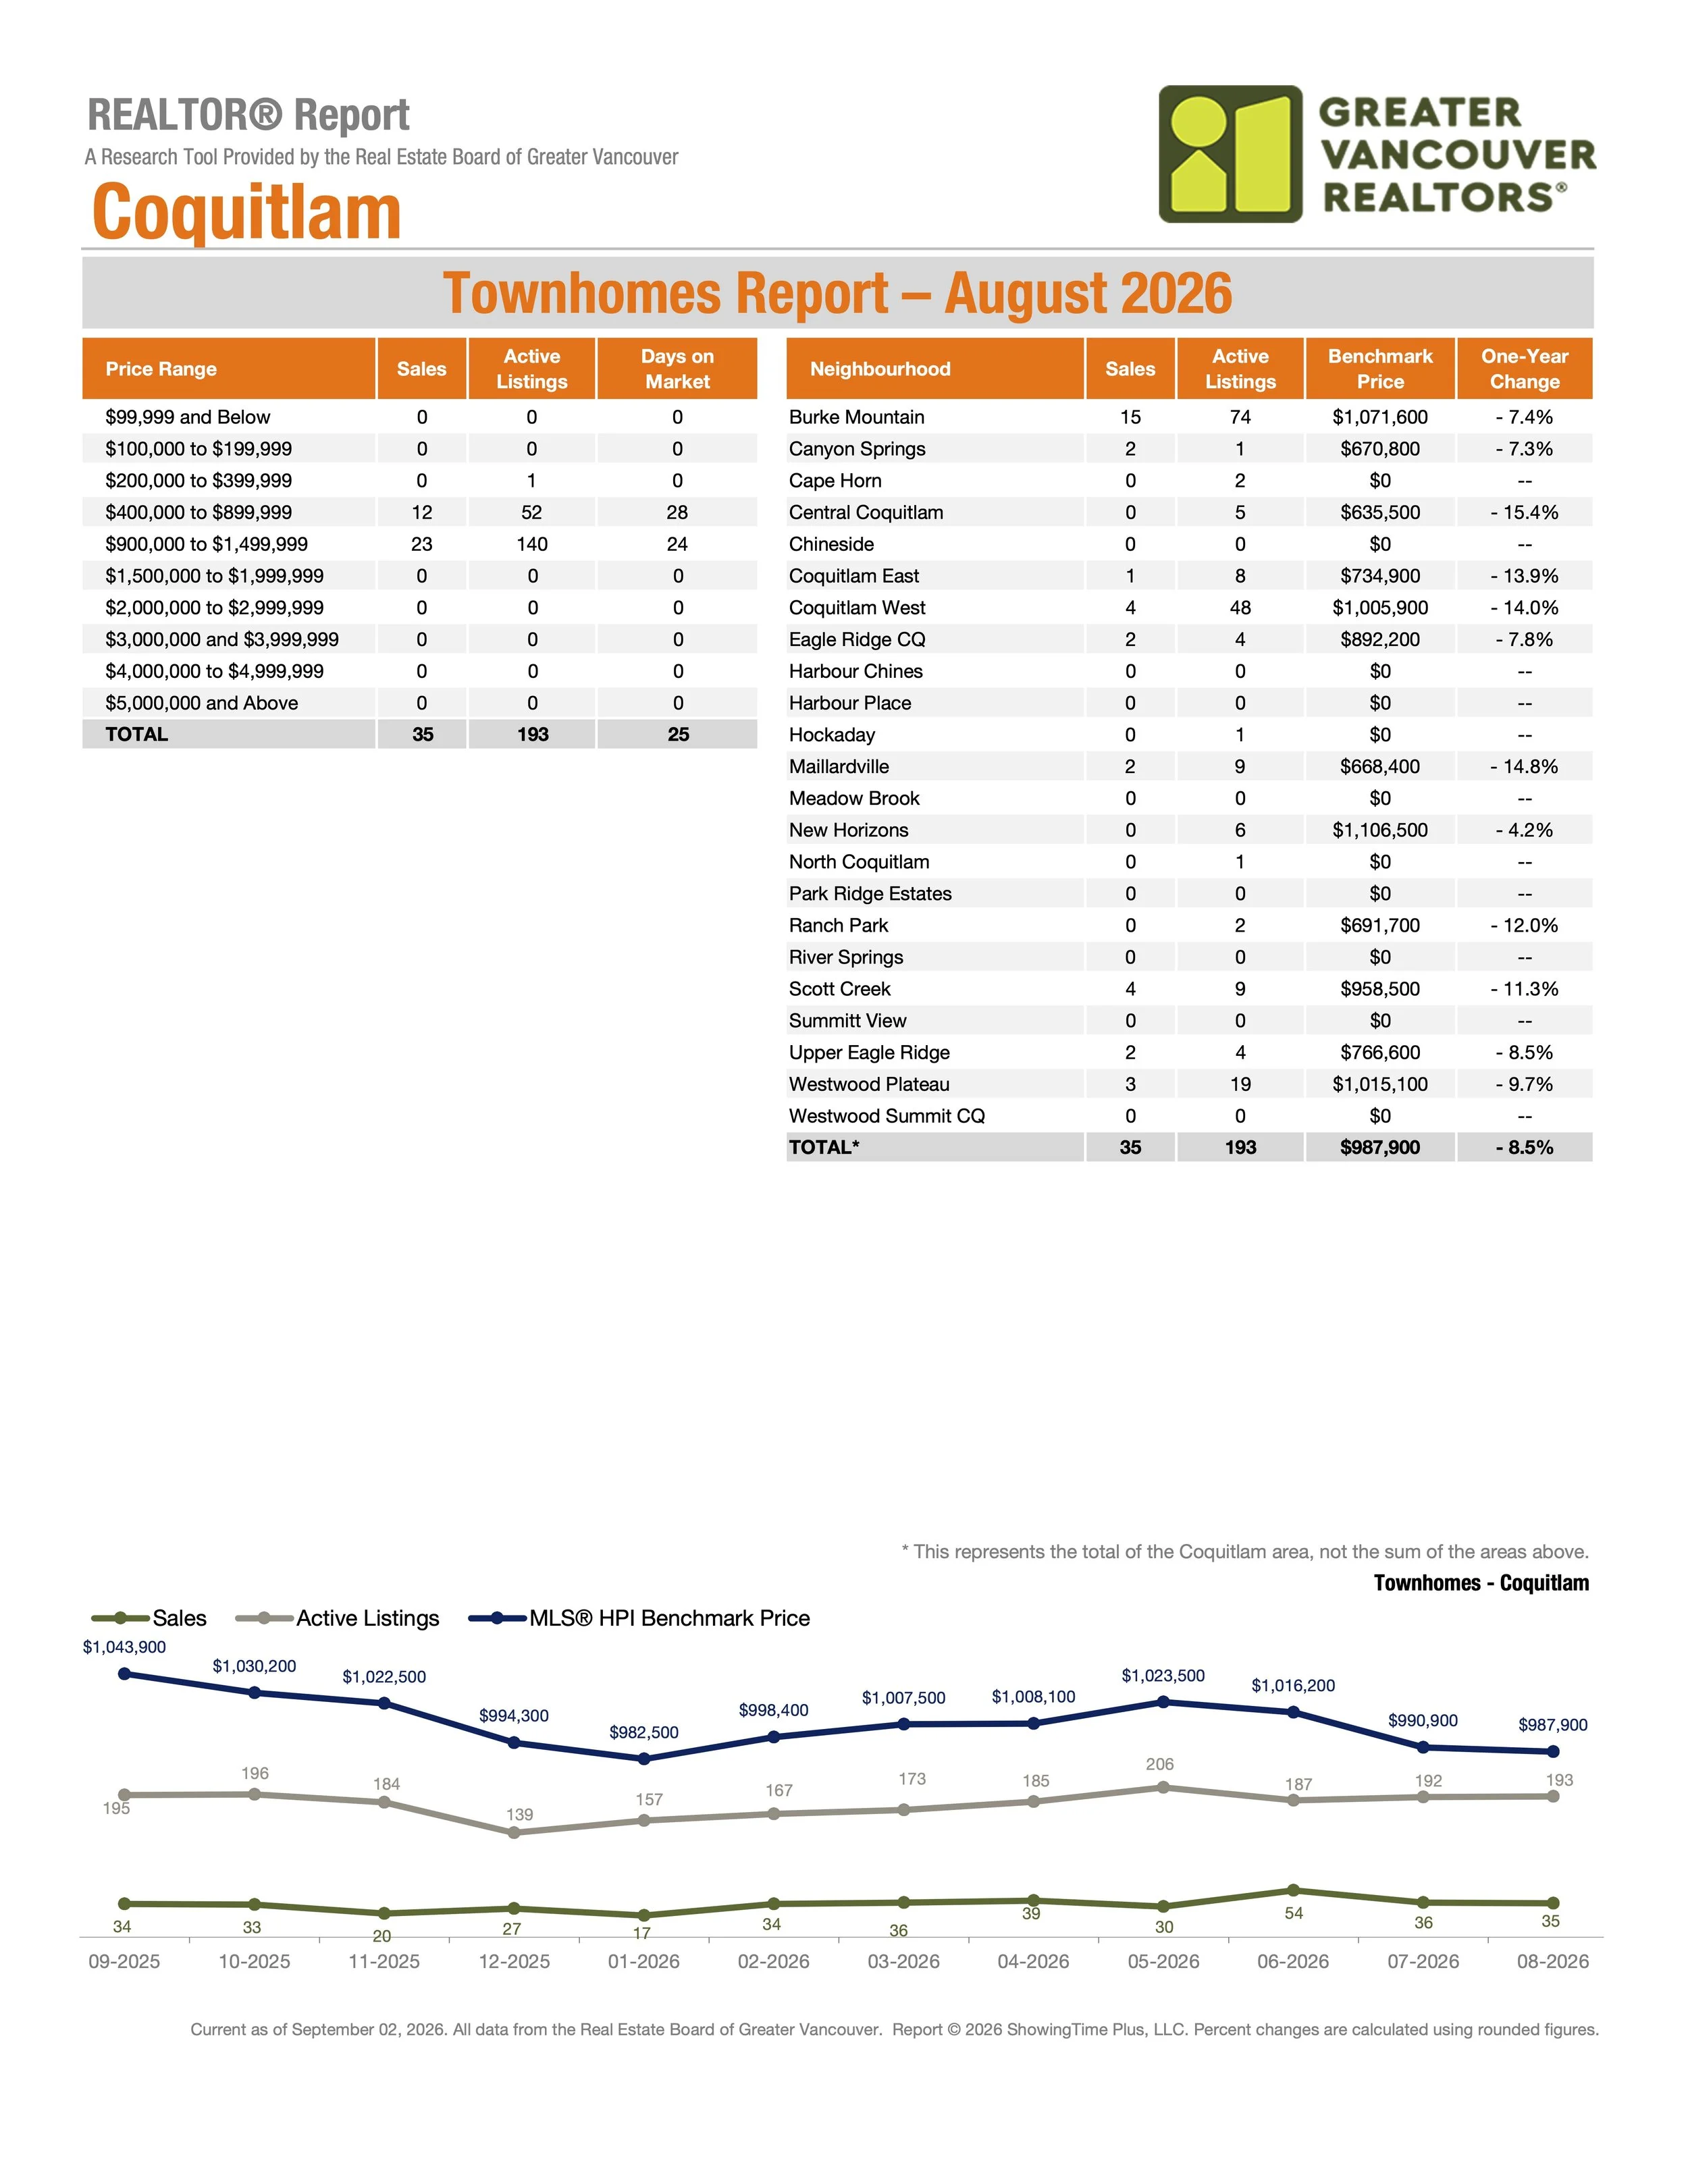
The total number of active listings on MLS® for Coquitlam townhomes in August 2026 was 193 vs 211 in August 2025, a decrease of 8.5%. The total number of sales on MLS® for Coquitlam townhomes in August 2026 was 35 vs 33 in August 2025, an increase of 6.1%. The average days on market on MLS® for Coquitlam townhomes in August 2026 was 25 vs 23 in August 2025, an increase of 8.7%. The MLS® HPI Benchmark Price for Coquitlam townhomes in August 2026 was $987,900 vs $1,079,500 in August 2025, a decrease of 8.5% or $91,600
Port Coquitlam Real Estate Market Stats For August 2026
PORT COQUITLAM:
The Port Coquitlam market stats include the neighbourhoods of Birchland Manor, Central Port Coquitlam, Citadel, Glenwood, Lincoln Park, Lower Mary Hill, Mary Hill, Oxford Heights, Riverwood and Woodland Acres.
Port Coquitlam Detached Properties:
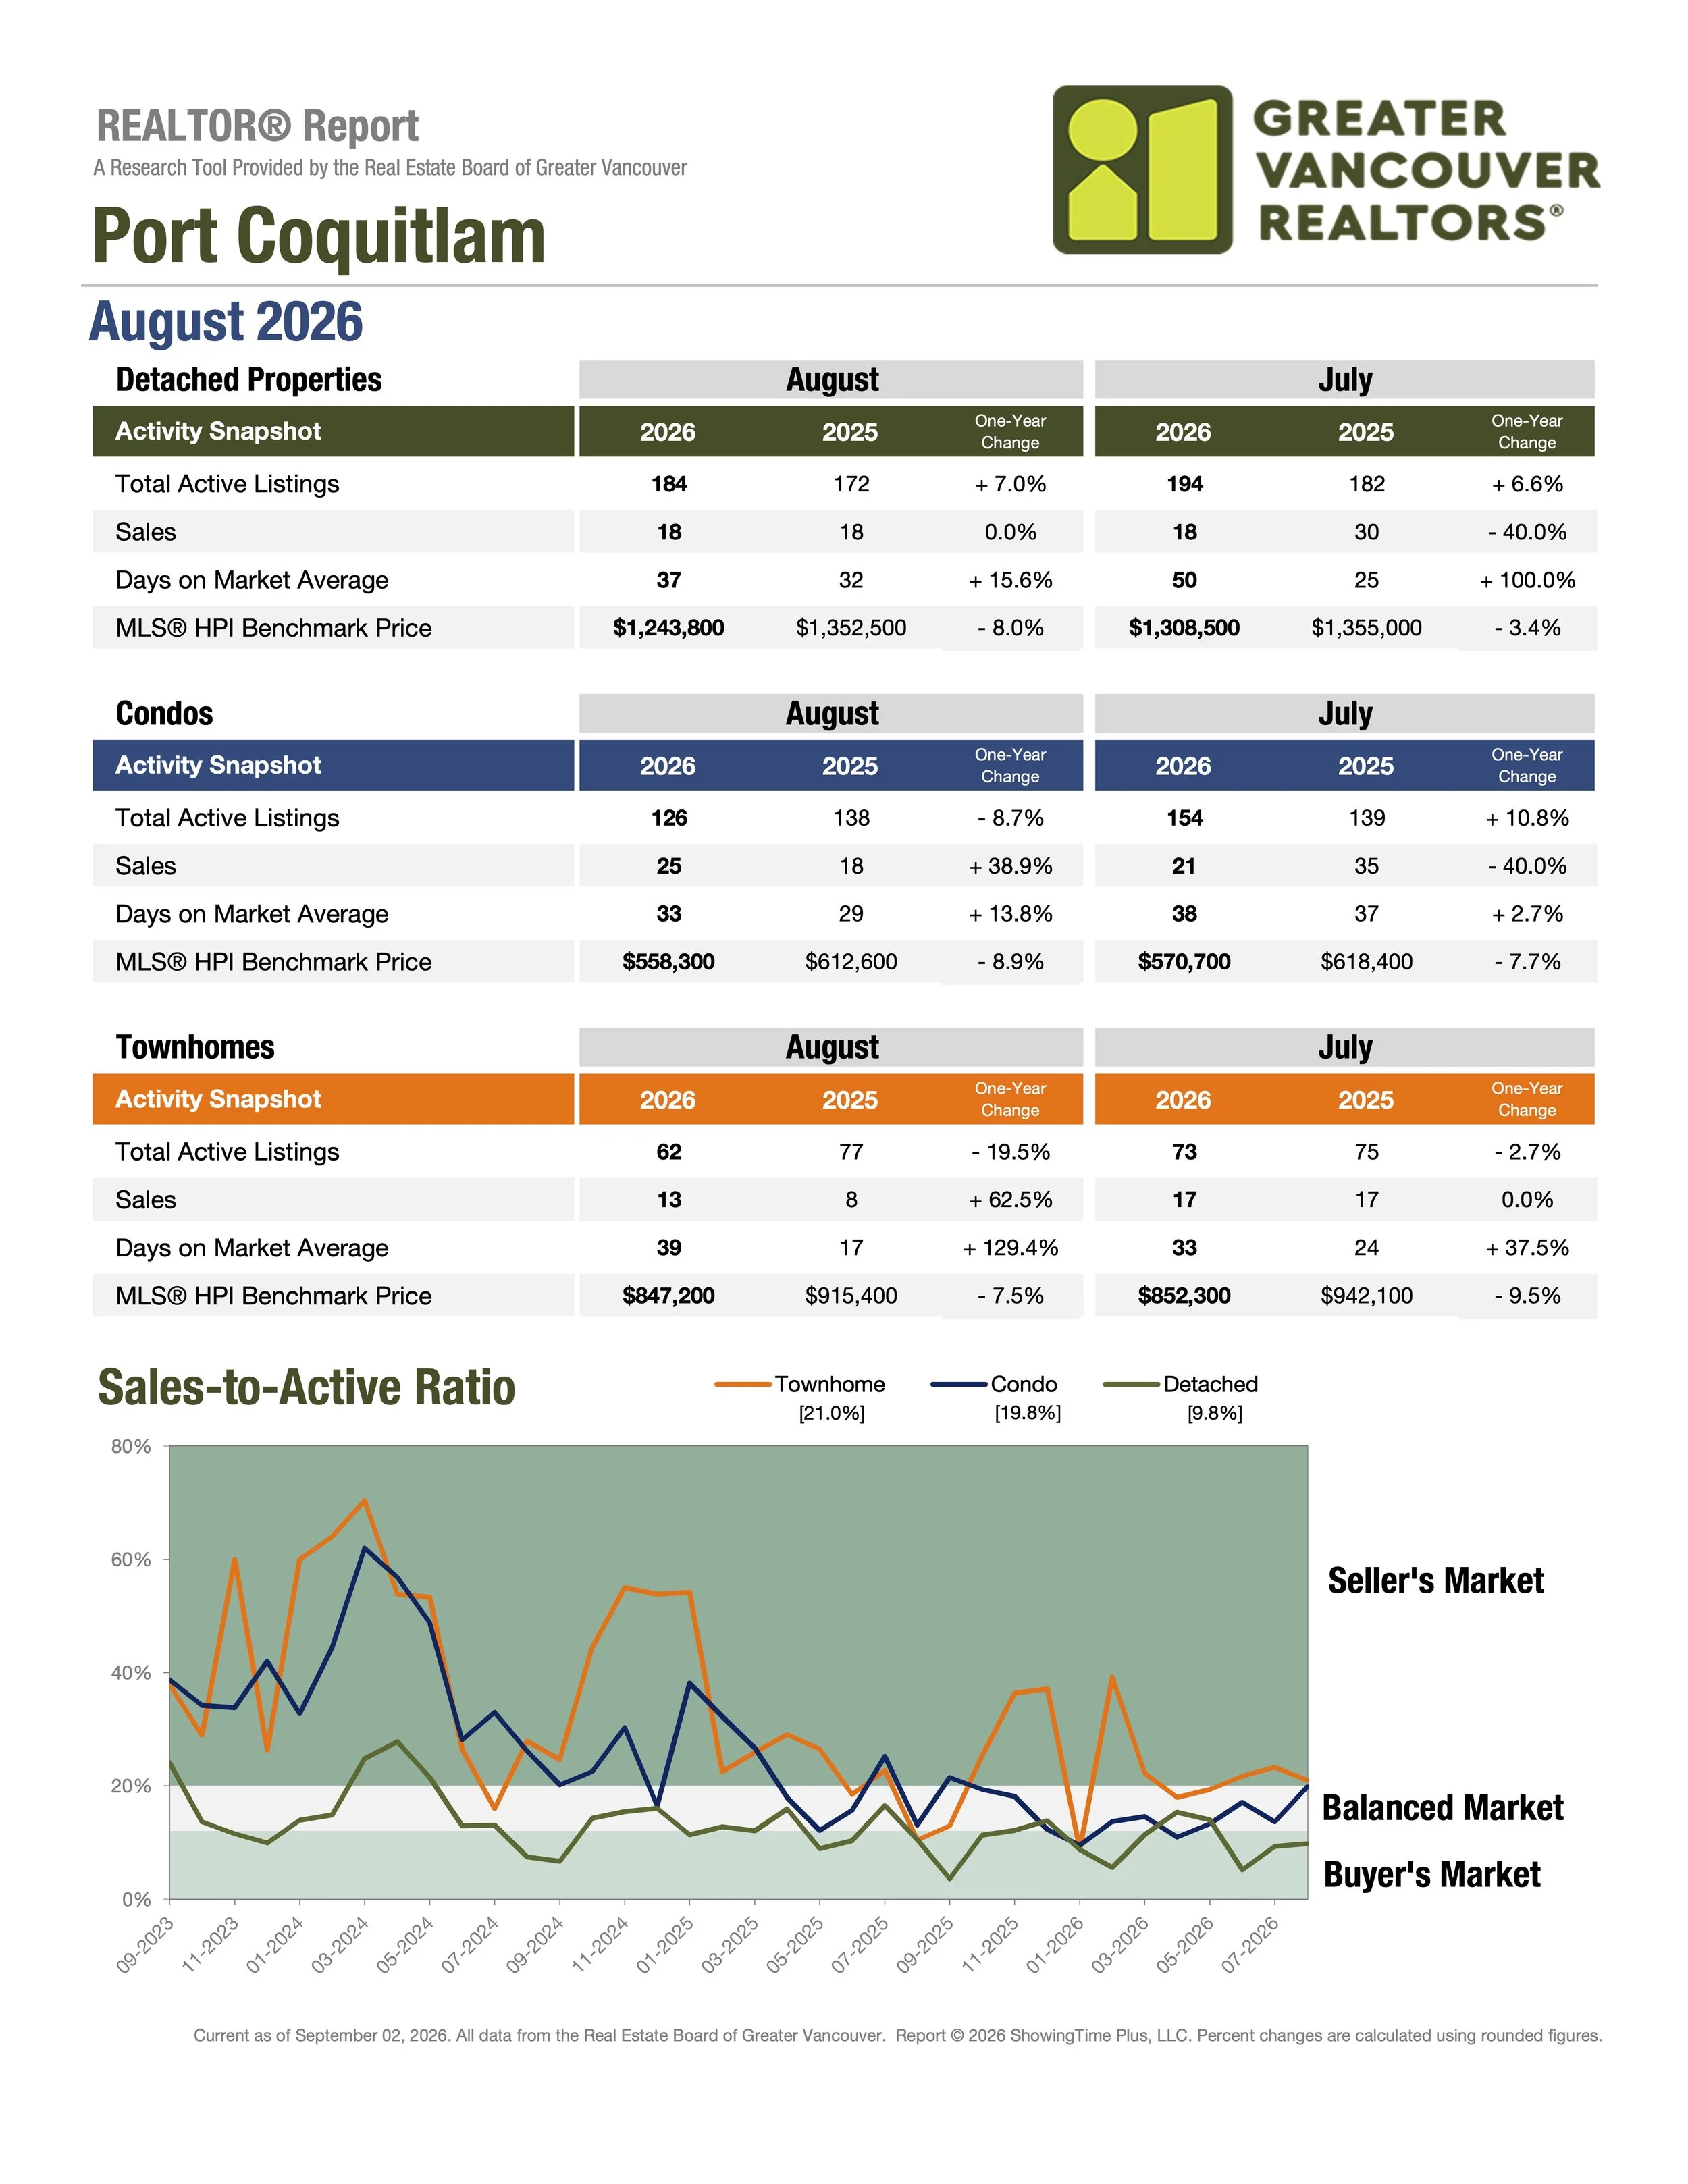
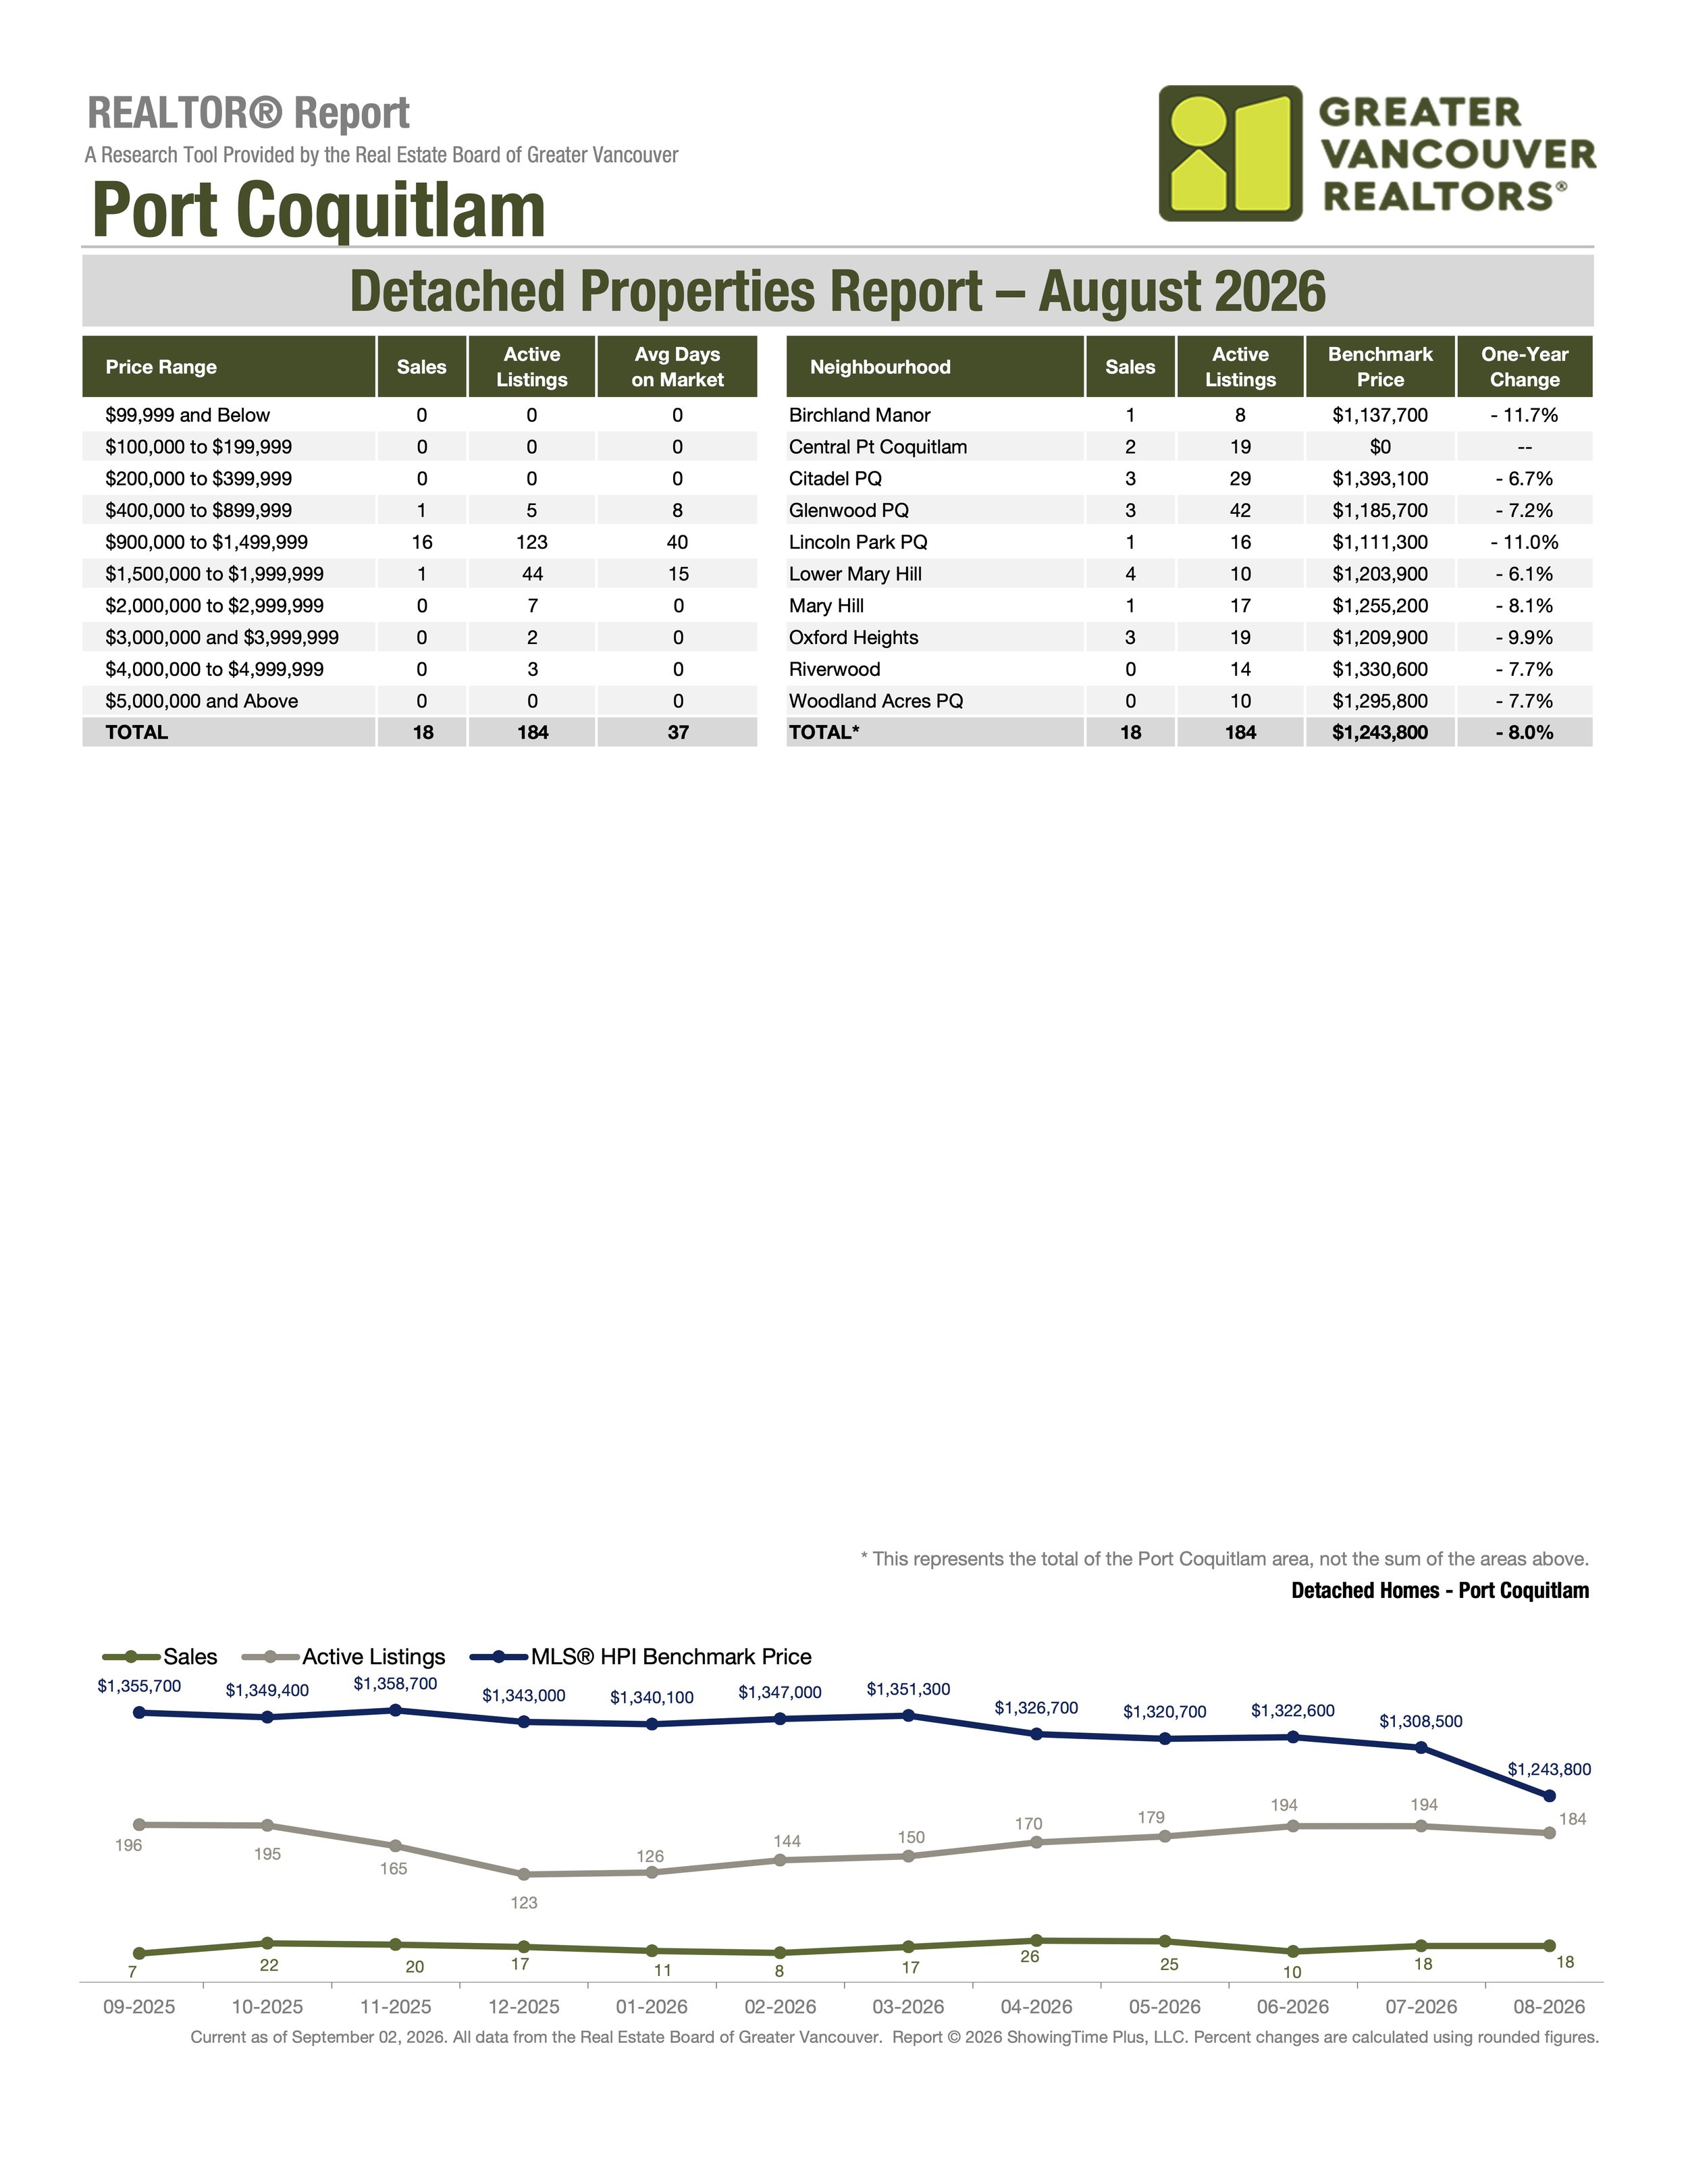
The total number of active listings on MLS® for Port Coquitlam detached properties in August 2026 was 184 vs 172 in August 2025, an increase of 7.0%. The total number of sales on MLS® for Port Coquitlam detached properties in August 2026 was 18 vs 18 in August 2025, a change of 0.0%. The average days on market on MLS® for Port Coquitlam detached properties in August 2026 was 37 vs 32 in August 2025, an increase of 15.6%. The MLS® HPI Benchmark Price for Port Coquitlam detached properties in August 2026 was $1,243,800 vs $1,352,500 in August 2025, a decrease of 8.0% or $108,700.
Port Coquitlam Condos:
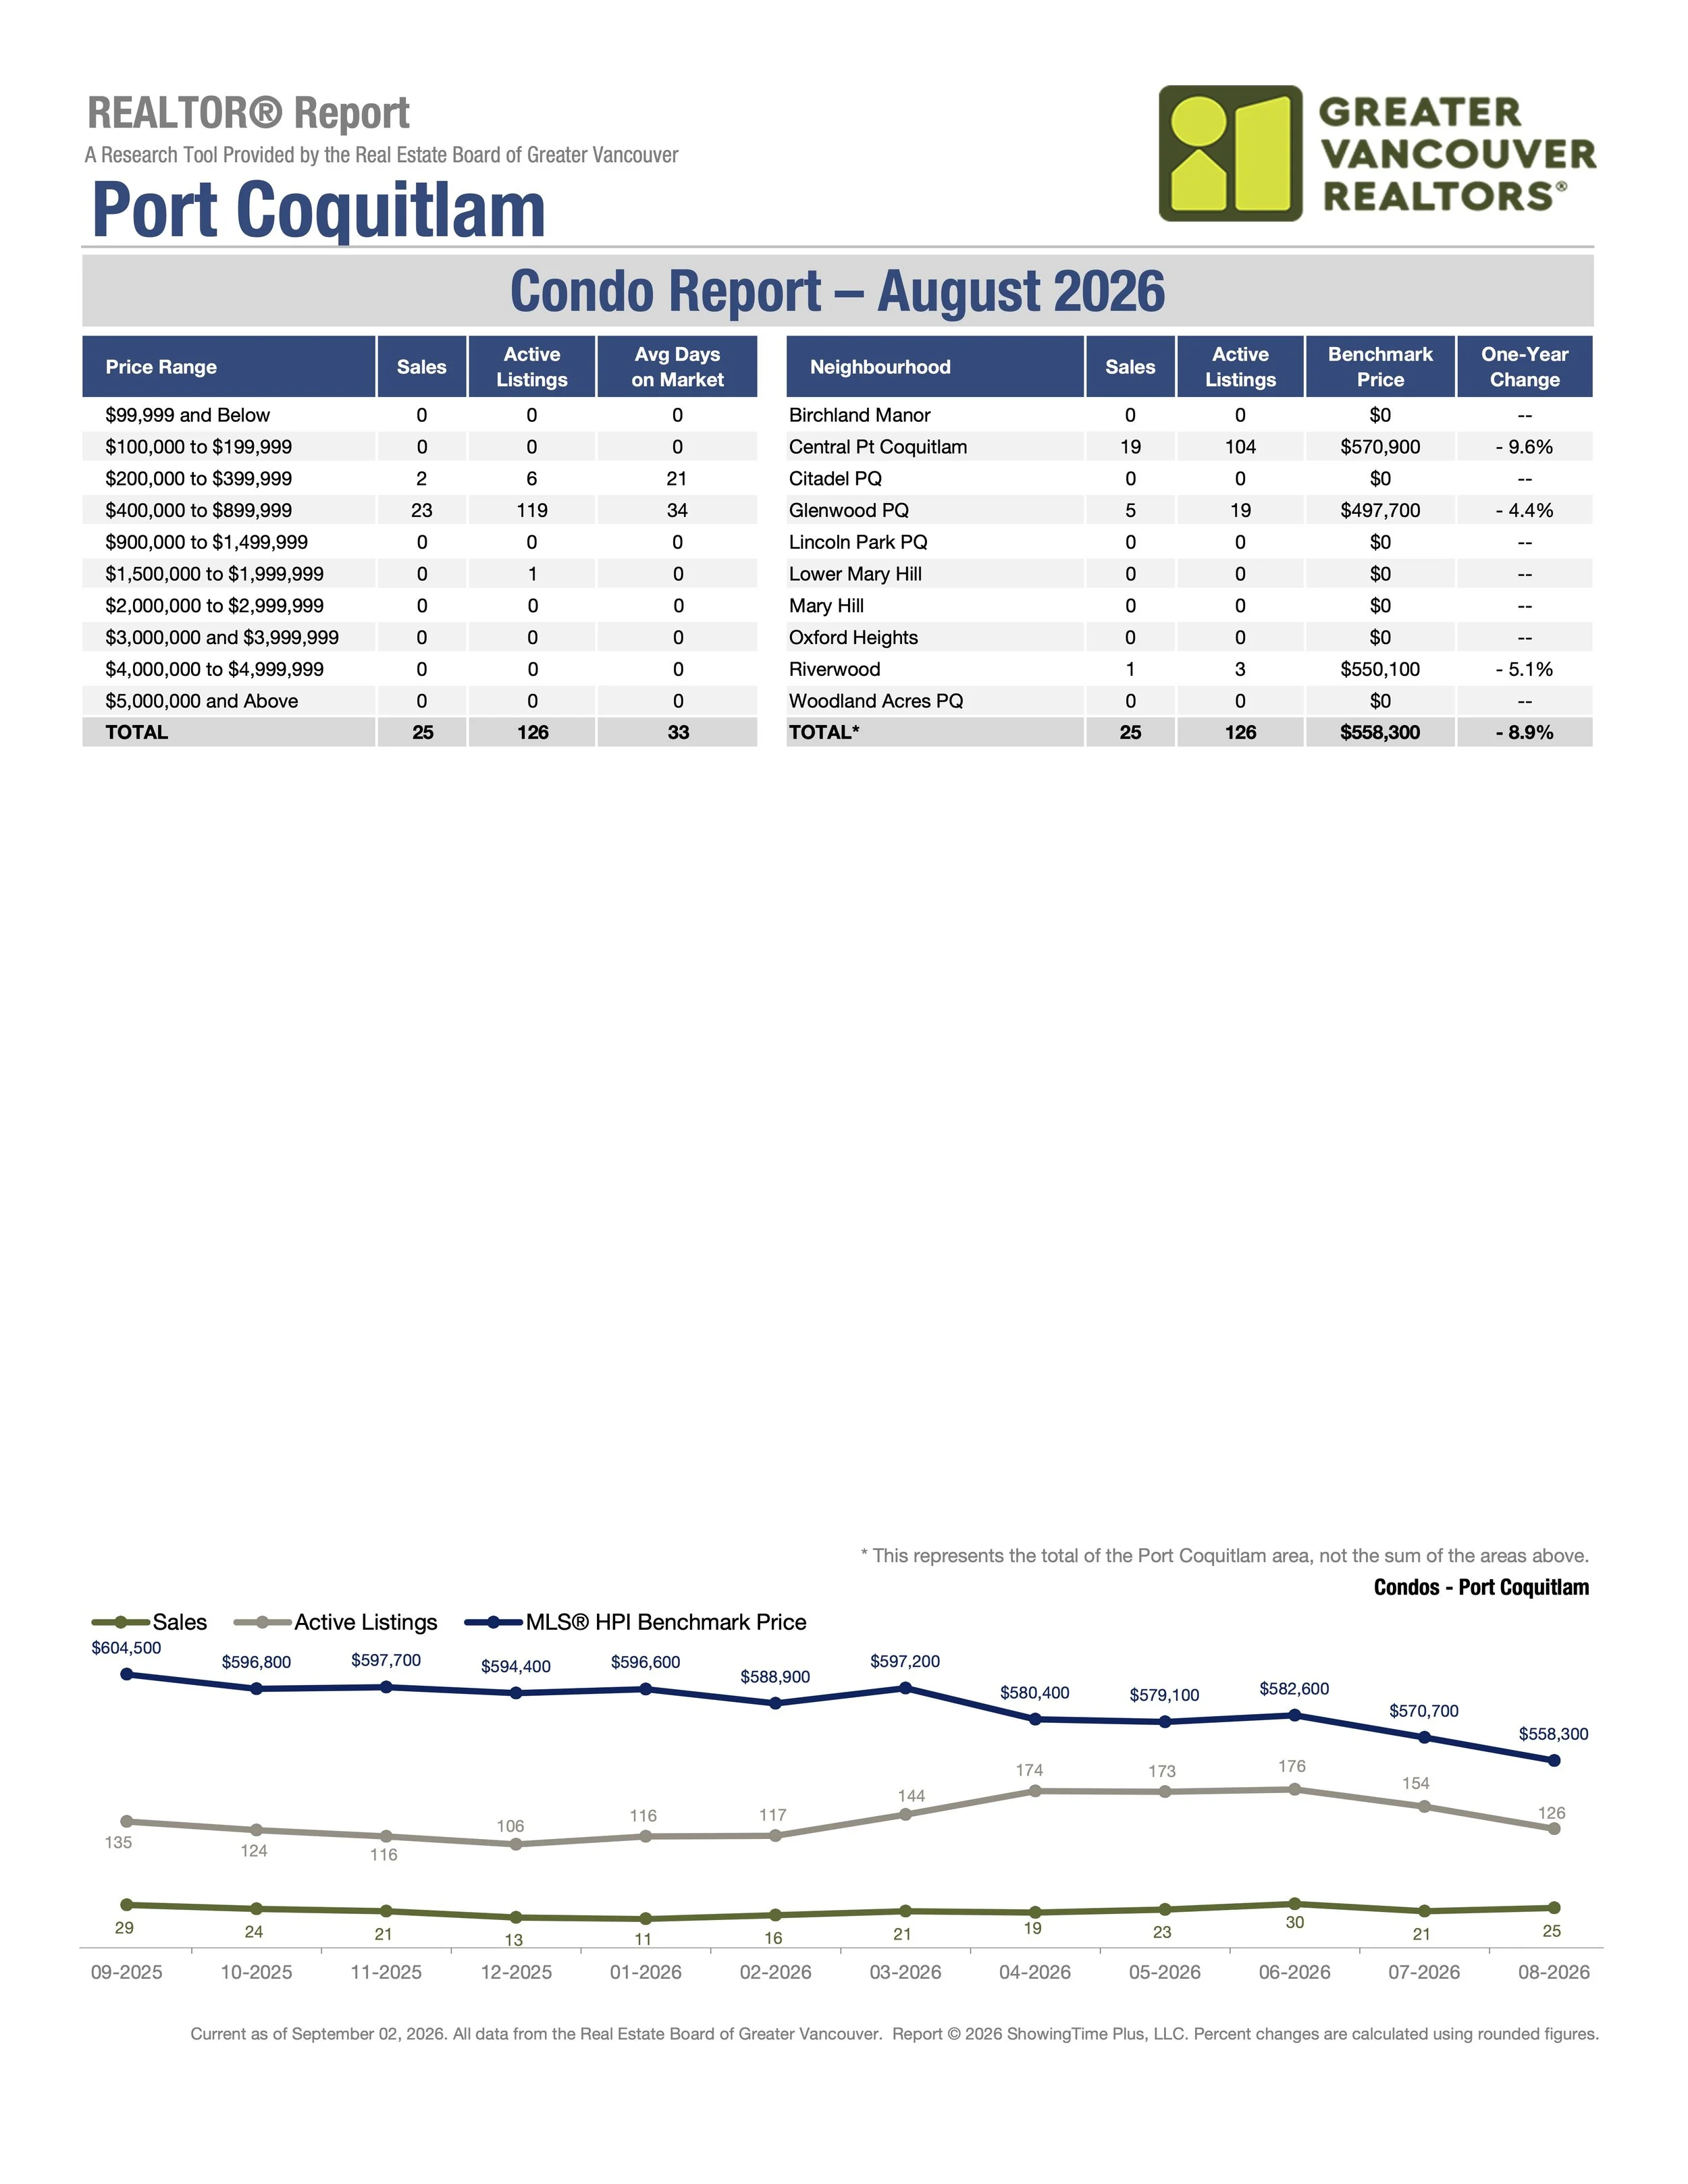
The total number of active listings on MLS® for Port Coquitlam condos in August 2026 was 126 vs 138 in August 2025, a decrease of 8.7%. The total number of sales on MLS® for Port Coquitlam condos in August 2026 was 25 vs 18 in August 2025, an increase of 38.9%. The average days on market on MLS® for Port Coquitlam condos in August 2026 was 33 vs 29 in August 2025, an increase of 13.8%. The MLS® HPI Benchmark Price for Port Coquitlam condos in August 2026 was $558,300 vs $612,600 in August 2025, a decrease of 8.9% or $54,300.
Port Coquitlam Townhomes:
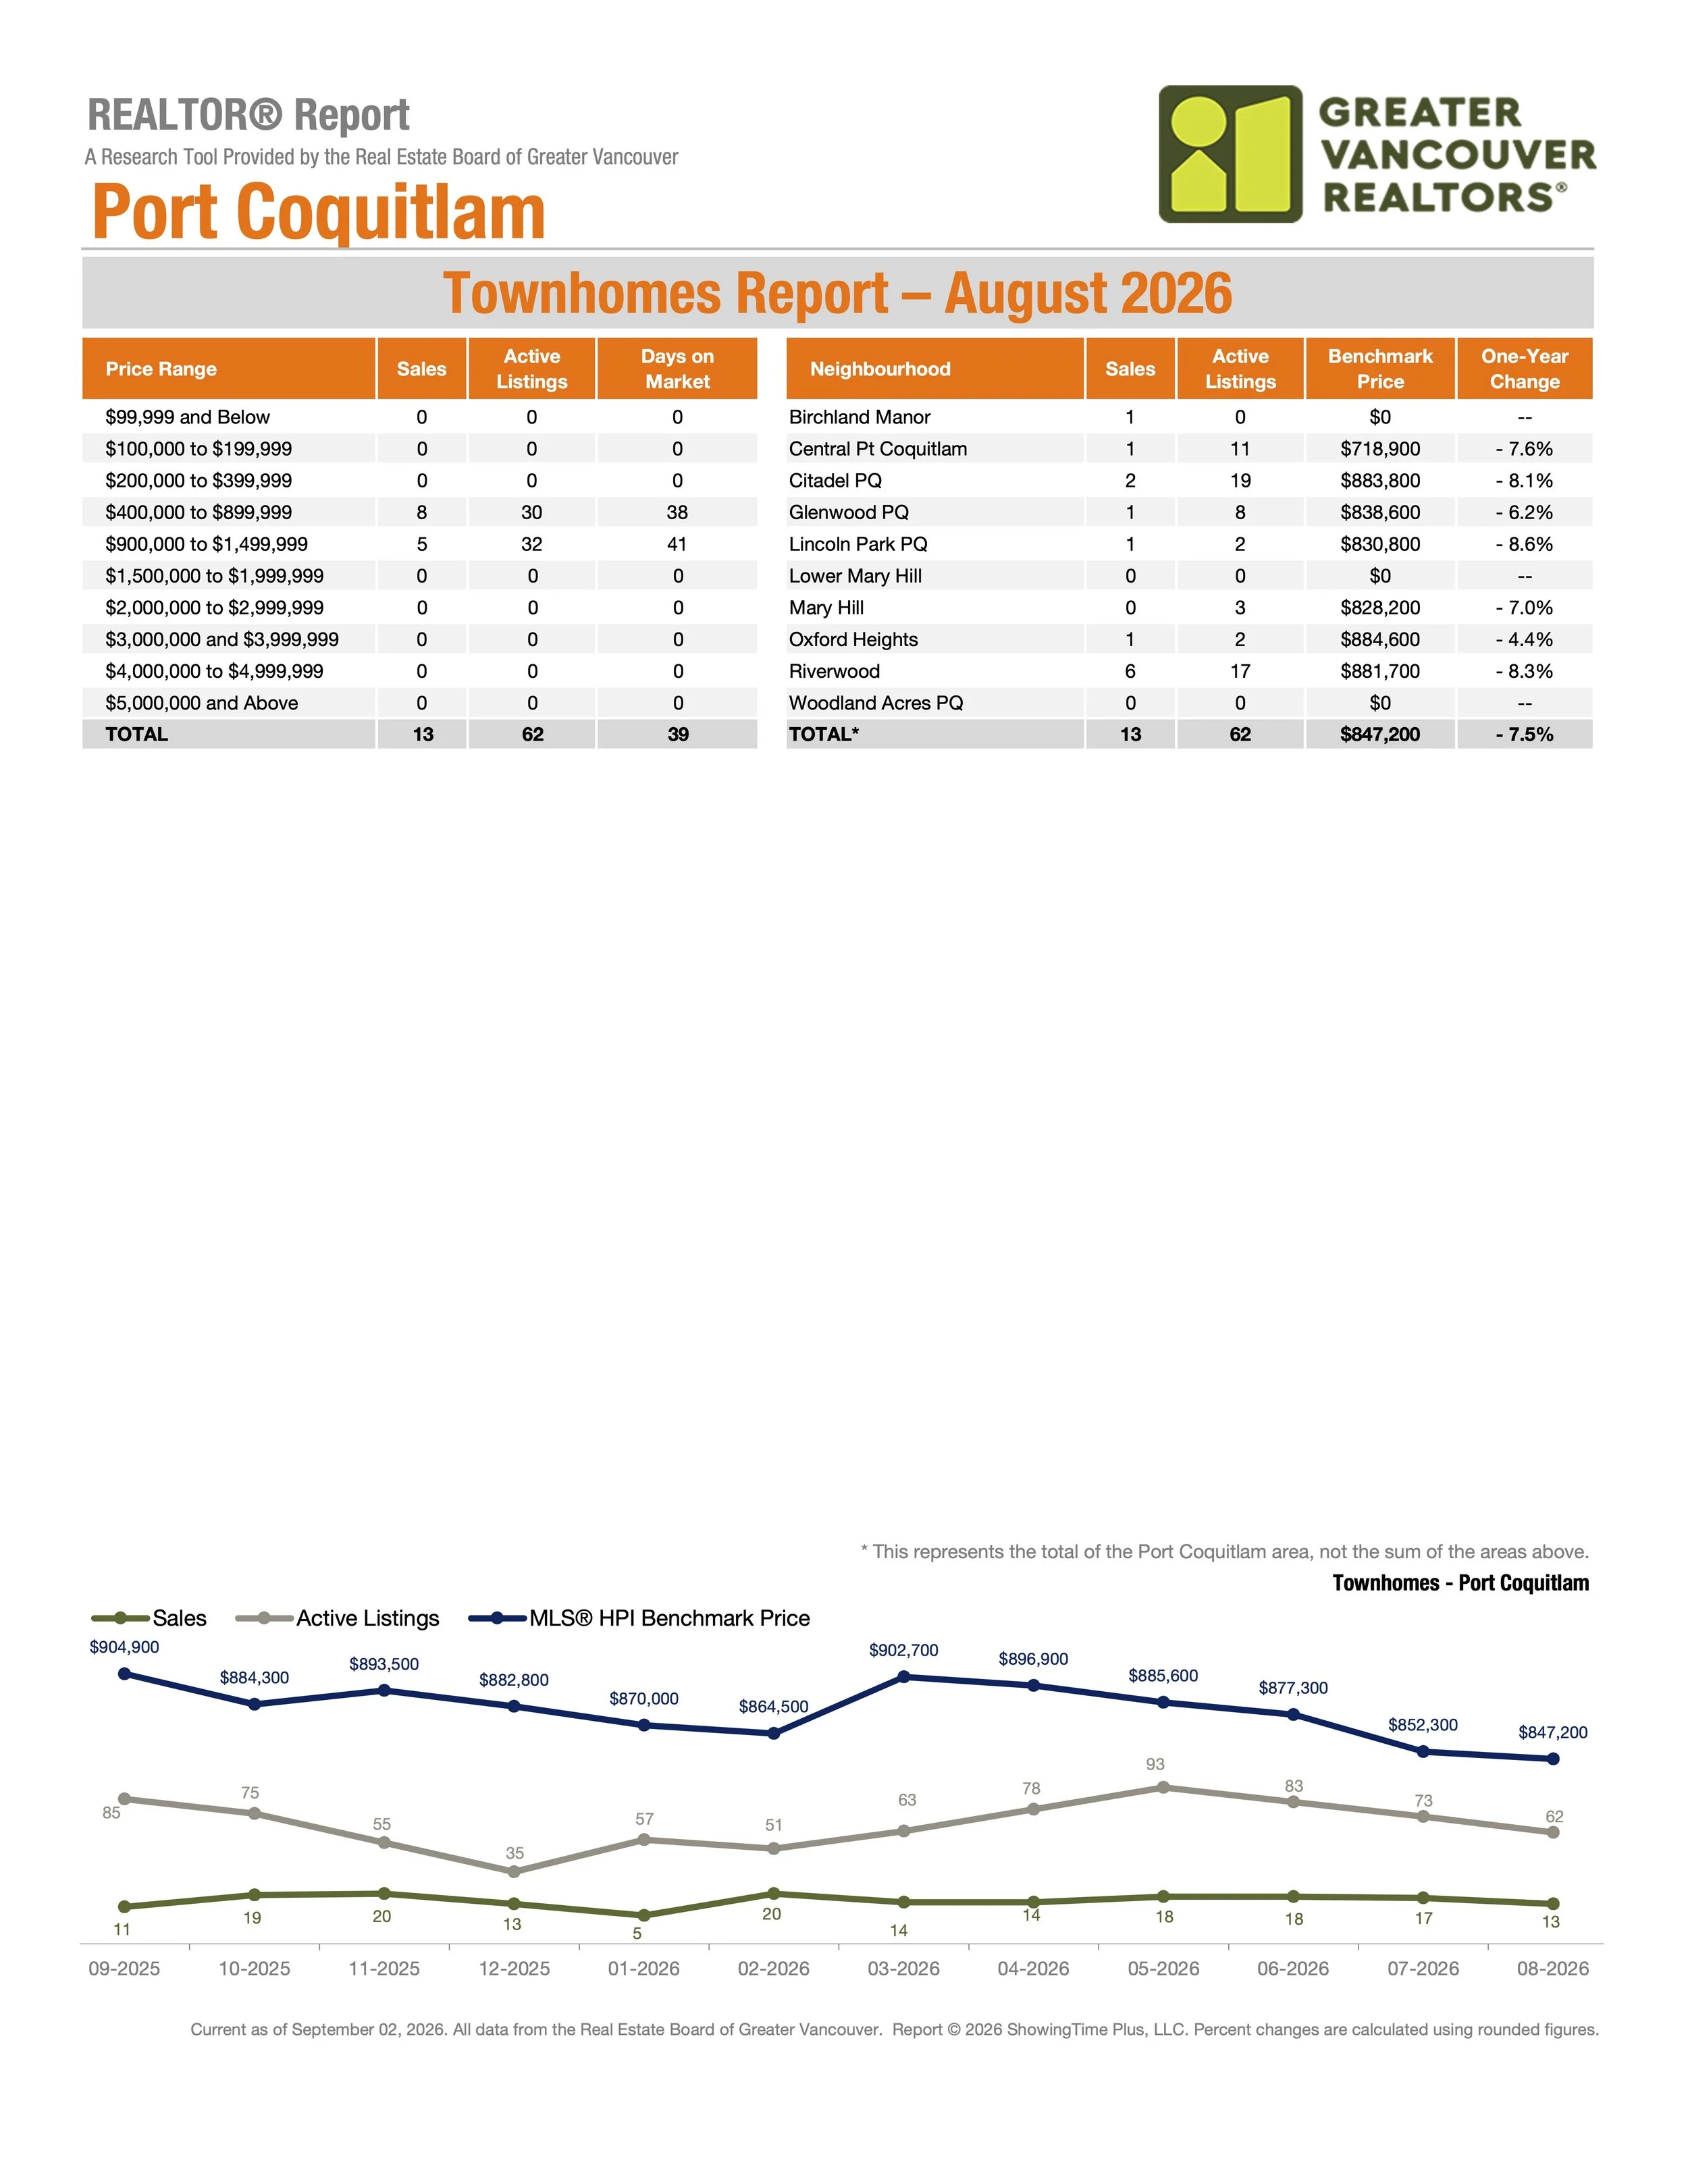
The total number of active listings on MLS® for Port Coquitlam townhomes in August 2026 was 62 vs 77 in August 2025, a decrease of 19.5%. The total number of sales on MLS® for Port Coquitlam townhomes in August 2026 was 13 vs 8 in August 2025, an increase of 62.5%. The average days on market on MLS® for Port Coquitlam townhomes in August 2026 was 39 vs 17 in August 2025, an increase of 129.4%. The MLS® HPI Benchmark Price for Port Coquitlam townhomes in August 2026 was $847,200 vs $915,400 in August 2025, a decrease of 7.5% or $68,200.
If you have any questions related to the August 2026 Tri-Cities Real Estate Market Stats for Port Moody, Coquitlam, Port Coquitlam, Anmore and Belcarra, we’d love to connect with you and help you and your family achieve your real estate goals!
Our office is centrally located in Suter Brook Village, Port Moody and we look forward to hearing from you.
Pogue Real Estate Group
Your trusted name in Tri-Cities Real Estate
Carolyn Pogue Personal Real Estate Corporation
Port Moody REALTOR® + Coquitlam REALTOR®
Source: (Greater Vancouver REALTORS®) - a research tool provided by the Real Estate Board of Greater Vancouver.
About Carolyn Pogue Personal Real Estate Corporation
Port Moody REALTOR® + Burke Mountain, Coquitlam Real Estate Agent:
As Team Lead of Pogue Real Estate Group in Port Moody, I pride myself on providing exceptional service, innovative marketing strategies and a relentless work ethic for all of our clients. My team and I proudly help families throughout Greater Vancouver, particularly within Port Moody, Burke Mountain, Coquitlam and Port Coquitlam.
At this stage of my career, I am fortunate that the majority of my clients come from referrals and repeat business. I work alongside my husband and business partner Brian, who is also a licensed REALTOR® and Chartered Professional Accountant. We take a family-first approach to real estate - being involved in our community and giving back is very important to us. We proudly support various organizations and charities which are close to our heart and this is part of what motivates us to continue to work hard every day.
Carolyn Pogue specializes in selling real estate in Port Moody, Burke Mountain and Coquitlam. Carolyn Pogue is rated one of the best Port Moody REALTORS®, one of the best Burke Mountain REALTORS® and one of the best Coquitlam REALTORS®*. Carolyn Pogue also specializes in selling Burke Mountain presale homes, Burke Mountain presale townhomes, Port Moody presale townhomes and Port Moody presale condos.
Pogue Real Estate Group
Your trusted name in Tri-Cities Real Estate
*Source: Rate-My-Agent.com